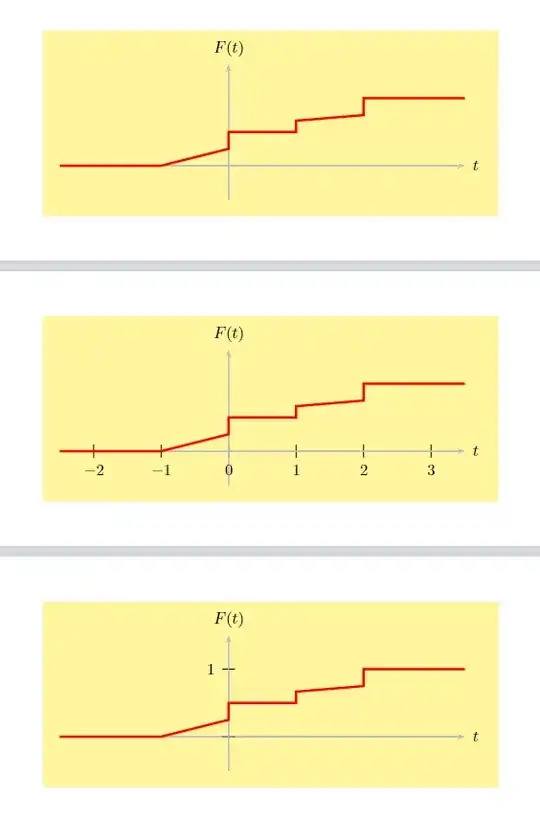
You should add the options ticks and labels to the \psaxes macro. The options can take different keys, such as all, none, x and y. Using, for example ticks=none, labels=none would hide all ticks and all labels. Using ticks=y, labels=y would show ticks and labels only on the y axis. For more information about such options, I'd suggest to have a look in the manual.
\documentclass[border=10mm,pstricks]{standalone}
\usepackage{pst-plot}
\begin{document}
\psset{unit=1.5cm}
\begin{pspicture}showgrid=false(4,2)
    \psframe*linecolor=yellow,opacity=0.5(4,2)
    \psaxes[linecolor=lightgray,ticks=none,labels=none]{->}(0,0)(-2.5,-0.5)(3.5,1.5)[$t$,0][$F(t)$,90]
    \psset{algebraic,linewidth=1.5pt,linecolor=red}
    \pscustom
    {
        \psplot{-2.5}{-1}{0}
        \psplot{-1}{0}{(x+1)/4}
        \psplot{0}{1}{1/2}
        \psplot{1}{2}{(x+7)/12}
        \psplot{2}{3.5}{1}
    }
\end{pspicture}
\begin{pspicture}showgrid=false(4,2)
    \psframe*linecolor=yellow,opacity=0.5(4,2)
    \psaxes[linecolor=lightgray,ticks=x,labels=x]{->}(0,0)(-2.5,-0.5)(3.5,1.5)[$t$,0][$F(t)$,90]
    \psset{algebraic,linewidth=1.5pt,linecolor=red}
    \pscustom
    {
        \psplot{-2.5}{-1}{0}
        \psplot{-1}{0}{(x+1)/4}
        \psplot{0}{1}{1/2}
        \psplot{1}{2}{(x+7)/12}
        \psplot{2}{3.5}{1}
    }
\end{pspicture}
\begin{pspicture}showgrid=false(4,2)
    \psframe*linecolor=yellow,opacity=0.5(4,2)
    \psaxes[linecolor=lightgray,ticks=y,labels=y]{->}(0,0)(-2.5,-0.5)(3.5,1.5)[$t$,0][$F(t)$,90]
    \psset{algebraic,linewidth=1.5pt,linecolor=red}
    \pscustom
    {
        \psplot{-2.5}{-1}{0}
        \psplot{-1}{0}{(x+1)/4}
        \psplot{0}{1}{1/2}
        \psplot{1}{2}{(x+7)/12}
        \psplot{2}{3.5}{1}
    }
\end{pspicture}
\end{document}

ticks=none, labels=noneas options to the\psaxesmacro. – Jasper Habicht Sep 30 '22 at 01:14ticks=y, labels=y, if you only want ticks and labels on the x axis, addticks=x, labels=x. Maybe have a look at the manual – Jasper Habicht Sep 30 '22 at 06:26