Two tikzpictures side by side
You need to hide the space between \end{tikzpicture} and \begin{tikzpicture} by adding a % otherwise this space will be put between the pictures.
Since TikZ considers the line width when determing the bounding box you will then have a seemingly a double wide line there. I suggest using the trim left and trim right options.
(We can't use (0:8) there but would need to use (0:.6*8) since it doesn't take the scale in consideration which is why I'm using named coordinates along the plot.)
Shifting the second part
Though, you could also just draw both parts in one tikzpicture by shifting the second part about 16 units to the right, i.e. shift={(16,0)} or shift=(0:16).
Since your left side goes from x = 0 to 8 and the right side goes from −8 to 0 you have a total different of 16 units between both x = 0.
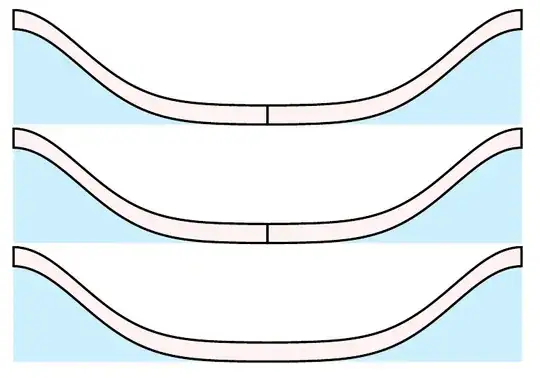
Drawing it together
If you want, you can also draw it at once ine one path (without the vertical bar between them).
We still use the shift=(0:16) key so that the plot domain works correctly but this time only for a part of the path by enclosing that part including the transformation in { and }.
The vertical line can simply added by
\draw[very thick] (0:8) -- ++ (up:.6);
Code
\documentclass{article}
\usepackage{tikz}
\begin{document}
\begin{tikzpicture}[
  declare function={gauss(\x)=3*exp(-(\x/3)^2);}, scale = 0.6,
  trim right=(@tr)]
\fill[cyan!20]
  plot[domain=0:8, samples=100] (\x, {gauss(\x)}) coordinate (@tr) -| cycle;
\filldraw[fill=pink!20, very thick]
     plot[domain=0:8, samples=100] (\x, {gauss(\x)})
  -- plot[domain=8:0, samples=100] (\x, {gauss(\x)+0.6}) -- cycle;
\end{tikzpicture}% <- important
\begin{tikzpicture}[
  declare function={gauss(\x)=3*exp(-(\x/3)^2);}, scale = 0.6,
  trim left=(@tl)]
\fill[cyan!20]
  plot[domain=-8:0, samples=100] (\x, {gauss(\x)}) |- cycle
  coordinate[at start] (@tl);
\filldraw[fill=pink!20, very thick]
     plot[domain=-8:0, samples=100] (\x, {gauss(\x)})
  -- plot[domain=0:-8, samples=100] (\x, {gauss(\x)+0.6}) -- cycle;
\end{tikzpicture}
\begin{tikzpicture}[
  declare function={gauss(\x)=3*exp(-(\x/3)^2);},
  scale = 0.6]
\fill[cyan!20] plot[domain=0:8, samples=100]  (\x, {gauss(\x)}) -| cycle;
\filldraw[fill=pink!20, very thick]
               plot[domain=0:8, samples=100]  (\x, {gauss(\x)})
            -- plot[domain=8:0, samples=100]  (\x, {gauss(\x)+0.6}) -- cycle;
\begin{scope}[shift=(0:16)]
\fill[cyan!20] plot[domain=-8:0, samples=100] (\x, {gauss(\x)}) |- cycle;
\filldraw[fill=pink!20, very thick]
               plot[domain=-8:0, samples=100] (\x, {gauss(\x)})
            -- plot[domain=0:-8, samples=100] (\x, {gauss(\x)+0.6}) -- cycle;
\end{scope}
\end{tikzpicture}
\begin{tikzpicture}[
  declare function={gauss(\x)=3*exp(-(\x/3)^2);},
  scale = 0.6,
  s/.style={shift=(0:16)}]
\fill [cyan!20]
          plot[domain= 0:8, samples=100] (\x, {gauss(\x)})
  {[s] -- plot[domain=-8:0, samples=100] (\x, {gauss(\x)})
       |- (-8,0)}
       -| cycle;
\filldraw[fill=pink!20, very thick]
          plot[domain=0:8, samples=100] (\x, {gauss(\x)})
  {[s] -- plot[domain=-8:0, samples=100] (\x, {gauss(\x)})
       -- plot[domain=0:-8, samples=100] (\x, {gauss(\x)+0.6})}
       -- plot[domain=8:0, samples=100] (\x, {gauss(\x)+0.6})
       -- cycle;
% \draw[very thick] (0:8) -- ++ (up:.6);
\end{tikzpicture}
\end{document}
Output


%between the twotikzpictures so that TeX doesn't put a space between them. – Qrrbrbirlbel Oct 03 '22 at 18:21