2

I'm trying to make an animated picture. In the two pictures below, I want the ball to move inside the semicircle for the first one, and on arc for the pendulum, and alongside the center mass projection in the x axis. The projection should have a sinusoidal motion for the pendulum.

Edit: Dashed arc issue was fixed by @Black Mild.

enter image description here enter image description here

Here is my code:

\documentclass[preview,border=1cm]{standalone}
\usepackage{pgfplots}
\usepackage{tikz}
\usepackage{xcolor}
\usetikzlibrary{arrows,shapes,positioning}
\usetikzlibrary{decorations.markings,decorations.pathmorphing,
decorations.pathreplacing}
\usetikzlibrary{calc,patterns,shapes.geometric}
%Circle
\begin{document}
\begin{tikzpicture}
\draw[line width=1pt,color=red,-latex](-3,0)--(3,0);
\draw[fill=orange!20] (2,2) -- (-2,2) arc(180:360:2) --cycle;
\draw[fill=gray] (-1.8,1.8) circle
(5pt)node[font=\tiny]{$\color{white}{m}$};
\draw[red,dashed](-2,1.8)--(-2,0)node[above,font=\large]{$-x_m$};
\draw[red,dashed](2,1.8)--(2,0)node[above,font=\large]{$x_m$};
\fill [pattern=north east lines] (-3,-0.2) rectangle (3,0); 
\end{tikzpicture}
%pendulum
\begin{tikzpicture}
\draw[line width=1pt,color=gray,dashed](0,-2)--(0,4);
\draw[line width=1pt,color=gray](0,4)--(3,0);
\draw[line width=1pt,color=red,-latex](-4,-1)--(4,-1);
\draw[red,dashed](3,0)--(3,-1)node[below,font=\large]{$x_m$};
\draw[red,dashed](-3,0)--(-3,-1)node[above,font=\large]{$-x_m$};
\draw[fill=gray] (3,0) circle
(5pt)node[font=\tiny]{$\color{white}{m}$};
\draw[dashed] (0,4) circle(5cm);

\end{tikzpicture} \end{document}

DINEDINE
  • 485
  • "I was trying to draw just a dashed arc" >>> Did you have a look at the PGF manual for the syntax of arc command? https://www.ctan.org/pkg/pgf – Black Mild Oct 05 '22 at 15:23
  • yes but all the arc i've drawn do not fit – DINEDINE Oct 05 '22 at 15:26
  • 1
    the dynamic tag, that you have added, seems to be inappropriate. Simple pendulum is a basic model in ODEs. Are you asking for an animated gif of a simple pendulum? I suggest improving the question to clarify it, and providing the mathematical context or source (textbook, link, etc) – Black Mild Oct 06 '22 at 16:02
  • a search in this texSE with keyword "pendulum" gives several results. In case you are interested in animated things, see https://tex.stackexchange.com/a/472050/140722 – Black Mild Oct 06 '22 at 16:12

2 Answers2

9

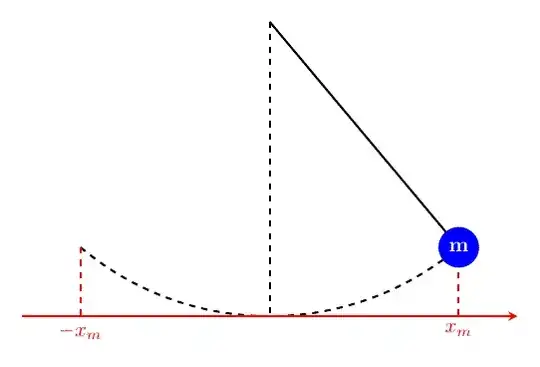
Since you want to animate the swing of the pendulum, I would suggest a different approach using polar coordinates. This makes things much easier (I used Black Mild's nice answer as basis for this, hence the similarity of the design):

\documentclass[border=10pt]{standalone}
\usepackage{animate}
\usepackage{tikz}

\pgfmathsetmacro{\pendulumswing}{40} \pgfmathsetmacro{\pendulumlength}{5}

\begin{document} \begin{animateinline}[controls, palindrome]{45} \multiframe{45}{rt=0+4}{% \begin{tikzpicture}[line width=1pt] \draw[dashed] (0:0) -- (90:{-\pendulumlength}) coordinate (o); \draw[dashed] ({90-\pendulumswing}:{-\pendulumlength}) coordinate (a) arc[start angle={90-\pendulumswing}, end angle={90+\pendulumswing}, radius={-\pendulumlength}] coordinate (b); \draw[dashed, red] (a) -- (a |- o) coordinate (c) node[below] {$-x_m$}; \draw[dashed, red] (b) -- (b |- o) coordinate (d) node[below] {$x_m$}; \draw[-stealth, red] ([xshift=-1cm]c) -- ([xshift=1cm]d);

            % variable \rt goes from 0 to 180
            % cos(\rt) returns a value between -1 and 1 following a (co)sine curve
            \pgfmathsetmacro{\pendulumangle}{cos(\rt)*\pendulumswing}
            \draw (0:0) -- ({90+\pendulumangle}:{-\pendulumlength})
                  node[circle, fill=blue, text=white] {$\mathbf{m}$};
        \end{tikzpicture}%
    }%
\end{animateinline}

\end{document}

enter image description here

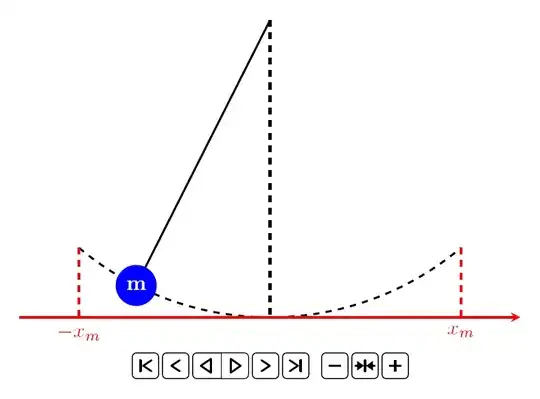
The macro \pendulumswing takes the maximum angle the pendulum goes to the left or right. The macro \pendulumlength takes the length of the pendulum. Change these values to get longer pendulums or pendulums with different deflection.

Compile and use Acrobat to play the animation. With other viewers, the animation may not work correctly. Below is a GIF approximation of the output:

enter image description here


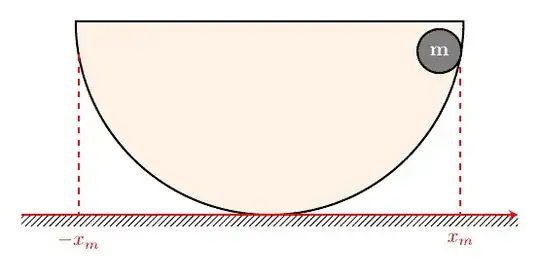
In a similar way, you can draw the first figure with the ball:

\documentclass[border=10pt]{standalone}
\usepackage{animate}
\usepackage{tikz}
\usetikzlibrary{patterns}

\pgfmathsetmacro{\pendulumswing}{80} \pgfmathsetmacro{\pendulumlength}{3} \pgfmathsetmacro{\floordepth}{0.2} \pgfmathsetmacro{\bobsize}{.75}

\begin{document} \begin{animateinline}[controls, palindrome]{45} \multiframe{45}{rt=0+4}{% \begin{tikzpicture}[line width=1pt] \coordinate (o) at (90:{-\pendulumlength-\bobsize/2}); \fill[orange!10, draw=black] (180:{-\pendulumlength-\bobsize/2}) coordinate (a) arc[start angle={180}, end angle={0}, radius={-\pendulumlength-\bobsize/2}] coordinate (b) -- cycle; \coordinate (a) at ({90-\pendulumswing}:{-\pendulumlength-\bobsize/2}); \coordinate (b) at ({90+\pendulumswing}:{-\pendulumlength-\bobsize/2}); \draw[dashed, red] (a) -- (a |- o) coordinate (c) node[below={\floordepth1cm}] {$-x_m$}; \draw[dashed, red] (b) -- (b |- o) coordinate (d) node[below={\floordepth1cm}] {$x_m$}; \fill[pattern=north east lines] ([xshift=-1cm]c) rectangle ([xshift=1cm, yshift={\floordepth*-1cm}]d); \draw[-stealth, red] ([xshift=-1cm]c) -- ([xshift=1cm]d);

            % variable \rt goes from 0 to 180
            % cos(\rt) returns a value between -1 and 1 following a (co)sine curve
            \pgfmathsetmacro{\pendulumangle}{cos(\rt)*\pendulumswing}
            \node[circle, draw, fill=gray, text=white, text width={\bobsize*1cm}, inner sep=0pt, align=center] 
                at ({90+\pendulumangle}:{-\pendulumlength}) {$\mathbf{m}$};
        \end{tikzpicture}%
    }%
\end{animateinline}

\end{document}

enter image description here


In case the animation becomes too slow, because it has so many frames or for whatever reason, you can tweak the frame rate and/or reduce the number of steps, for example using:

% [...]
    \begin{animateinline}[controls, palindrome]{30}
        \multiframe{30}{rt=0+6}{%
            % [...]
        }
    \end{animateinline}
% [...]

You only need to make sure that the macro \rt goes from 0 to 180. Here, \multiframe{30}{rt=0+6} means that the variable \rt will start with 0 and is increased by 6 for each frame, with 30 frames in total (resulting in \rt being equal to 180 in the last frame).

MS-SPO
  • 11,519
  • 180 FPS is a lot. Normal video is 30 which is enough for human perception. I would not use more than this value. – AlexG Oct 07 '22 at 09:37
  • @AlexG Yes, you are right. But one would need to adjust the number of frames then, right? Otherwise the animation will become slower. This is what I meant with the addedum below. Or maybe I am not understanding thigs right. – Jasper Habicht Oct 07 '22 at 09:42
  • 1
    Exactly. The number of animation frames is n=T*FPS, where T is the intended duration of the animation in seconds, e. g. the half time of one swing cycle of the pendulum (since you are using the palindrome option). As said before, for a fluid visual impression FPS=30 is enough. – AlexG Oct 07 '22 at 09:56
  • @AlexG Thank you for your input! I scaled the MWEs down a bit and also adjusted the addendum. Since I don't know how quick the OP want their animation to be, I leave the FPS/frame number ratio as it was before – Jasper Habicht Oct 07 '22 at 10:15
  • Thanks @JasperHabicht – DINEDINE Oct 07 '22 at 13:54
3

Here you are! a \clip is used to get the desired arc. PS: I am tired of cleaning your code ^^

enter image description here

\documentclass[tikz,border=1cm]{standalone}
\usepackage{amsmath,amssymb}
\begin{document}
% pendulum
\begin{tikzpicture}[line width=1pt]
\def\a{3}
\def\b{4}
\pgfmathsetmacro{\c}{sqrt(\a*\a+\b*\b)}     
\draw[dashed] (0,-1)--(0,\b);
\draw (0,\b)--(\a,0);
\draw[red,-latex] (-\a-1,-1)--(\a+1,-1);
\draw[red,dashed] 
(\a,0)--(\a,-1) node[below]{$x_m$}
(-\a,0)--(-\a,-1) node[below]{$-x_m$};
\begin{scope}
\clip (0,\b)--(\a,0)--(\a,-1)--(-\a,-1)--(-\a,0)--cycle;    
\draw[dashed] (0,\b) circle(\c);    
\end{scope}
\path (\a,0) node[circle,fill=blue,text=white]{$\mathbf{m}$};
\end{tikzpicture}
\end{document}
Black Mild
  • 17,569
  • What exactly is being used from the patterns library? (One of my difficulties trying to learn tikz is knowing which library is needed for what, and the roughly 300 pages on that in the Tikz/OGF Manual.) – murray Oct 06 '22 at 01:10
  • @murray that library is from the OP's first code, that I forgot to remove when cleaning the second. Please just remove \usetikzlibrary{patterns} ! – Black Mild Oct 06 '22 at 03:33
  • Thank you @BlackMild. Btw the question was about dynamical drawing, which let the ball move through the dashed arc – DINEDINE Oct 06 '22 at 15:20
  • @DINEDINE I guess that you are confusing "dynamical" (in Dynamical Sytems) with "animated" (in animated gif/pdf figure). Note that there is no question mark (?), no real question in the content of your "question" ^^ so actually, I do not know exactly what you are asking for – Black Mild Oct 06 '22 at 15:51
  • Sorry for not using the correct word. Actually it is an animated figure that I’m looking for. – DINEDINE Oct 06 '22 at 18:08
  • @BlackMild Question is edited. – DINEDINE Oct 06 '22 at 18:11