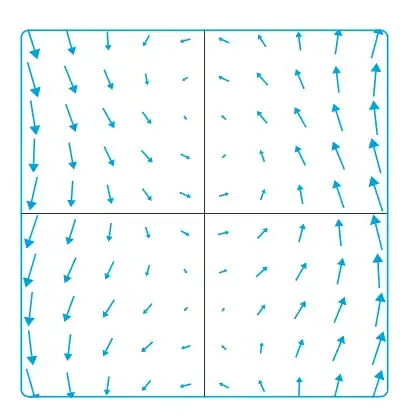
To get the arrow at center of grid coordinate, the (x,y) is subtracted half the arrow length.
\documentclass[tikz, border=1cm]{standalone}
\usetikzlibrary{arrows.meta}
\usepackage{pgfplots}
\pgfplotsset{compat=1.18}
\begin{document}
\begin{tikzpicture}
\clip[rounded corners] (-3.2,-3.2) rectangle (3.2,3.2);
\begin{axis}[
x=1cm, y=1cm, z=0cm,
view={0}{90},
anchor=center,
trig format plots=rad,
xmin=-3, xmax=3,
ymin=-3, ymax=3,
axis lines=center,
domain=-3:3,
y domain=-3:3,
enlargelimits=0.1,
ticks=none,
]
\addplot3[
cyan, thick,
point meta={sqrt((cos(x+y))^2+x^2)},
quiver={
  u={cos(x+y)}, v={x},
  scale arrows=0.2,
  every arrow/.append style={-{Triangle[scale=0.2+0.8*\pgfplotspointmetatransformed/1000]}},
},
samples=10,
] (x-0.1*cos(x+y),y-0.1*x,0);
\end{axis}
\draw[cyan, ultra thick, rounded corners] (-3.2,-3.2) rectangle (3.2,3.2);
\end{tikzpicture}
\end{document}
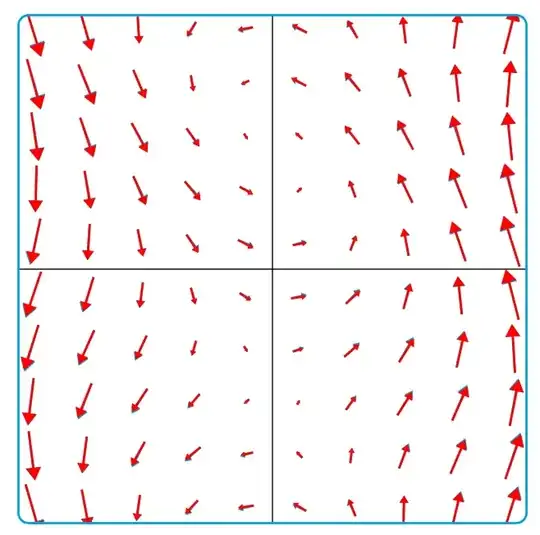
Edit: A more correct plot would be to calculate the arrow vector from this new position like in red below
\documentclass[tikz, border=1cm]{standalone}
\usetikzlibrary{arrows.meta}
\usepackage{pgfplots}
\pgfplotsset{compat=1.18}
\begin{document}
\begin{tikzpicture}
\clip[rounded corners] (-3.2,-3.2) rectangle (3.2,3.2);
\begin{axis}[
x=1cm, y=1cm, z=0cm,
view={0}{90},
anchor=center,
trig format plots=rad,
xmin=-3, xmax=3,
ymin=-3, ymax=3,
axis lines=center,
domain=-3:3,
y domain=-3:3,
enlargelimits=0.1,
ticks=none,
]
\addplot3[
cyan, thick,
point meta={sqrt((cos(x+y))^2+x^2)},
quiver={
  u={cos(x+y)}, v={x},
  scale arrows=0.2,
  every arrow/.append style={-{Triangle[scale=0.2+0.8*\pgfplotspointmetatransformed/1000]}},
},
samples=10,
] (x-0.1*cos(x+y),y-0.1*x,0);
\addplot3[
red, thick,
point meta={sqrt((cos((x-0.1*cos(x+y))+y))^2+(x-0.1*cos(x+y))^2)},
quiver={
  u={cos((x-0.1*cos(x+y))+y)}, v={x-0.1*cos(x+y)},
  scale arrows=0.2,
  every arrow/.append style={-{Triangle[scale=0.2+0.8*\pgfplotspointmetatransformed/1000]}},
},
samples=10,
] (x-0.1*cos(x+y),y-0.1*x,0);\end{axis}
\draw[cyan, ultra thick, rounded corners] (-3.2,-3.2) rectangle (3.2,3.2);
\end{tikzpicture}
\end{document}