\documentclass[tikz, border=1cm]{standalone}
\begin{document}
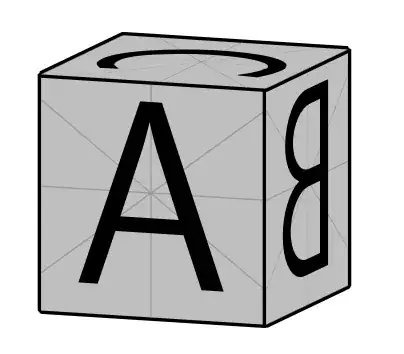
\begin{tikzpicture}[inner sep=0pt, outer sep=0pt, line join=bevel]
\node[draw, ultra thick, anchor=north east, yslant=-0.5] {\includegraphics[viewport={3.2cm 1.6cm 8.2cm 6.6cm}, clip]{example-image-a}};
\node[draw, ultra thick, anchor=north west, yslant=0.5] {\includegraphics[viewport={3.2cm 1.6cm 8.2cm 6.6cm}, clip]{example-image-b}};
\node[draw, ultra thick, anchor=south west, yslant=0.5, xslant=-1] {\includegraphics[viewport={3.2cm 1.6cm 8.2cm 6.6cm}, clip]{example-image-c}};
\end{tikzpicture}
\end{document}

Edit:
With tikz-3dplot instead of manual slant you can change the view angles in \tdplotsetmaincoords{80}{110}
\documentclass[tikz, border=1cm]{standalone}
\usepackage{tikz-3dplot}
\begin{document}
\tdplotsetmaincoords{80}{110}
\begin{tikzpicture}[tdplot_main_coords, inner sep=0pt, outer sep=0pt, line join=bevel]
\node[draw, ultra thick, transform shape, canvas is yz plane at x=1] {\includegraphics[scale=0.4, viewport={3.2cm 1.6cm 8.2cm 6.6cm}, clip]{example-image-a}};
\node[draw, ultra thick, transform shape, canvas is xz plane at y=1] {\includegraphics[scale=0.4, viewport={3.2cm 1.6cm 8.2cm 6.6cm}, clip]{example-image-b}};
\node[draw, ultra thick, transform shape, canvas is xy plane at z=1] {\includegraphics[scale=0.4, viewport={3.2cm 1.6cm 8.2cm 6.6cm}, clip]{example-image-c}};
\end{tikzpicture}
\end{document}
Edit:
\documentclass[tikz, border=1cm]{standalone}
\usepackage{tikz-3dplot}
\usepackage{adjustbox}
\begin{document}
\tdplotsetmaincoords{70}{110}
\begin{tikzpicture}[tdplot_main_coords, inner sep=0pt, outer sep=0pt, line join=bevel]
\node[draw, thick, transform shape, canvas is yz plane at x=1]            {\adjustbox{trim={0.250\width} {0.333\height} {0.500\width} {0.333\height}, clip}{\includegraphics[width=8cm]{ulvyP.png}}};
\node[draw, thick, transform shape, canvas is xz plane at y=1, xscale=-1] {\adjustbox{trim={0.500\width} {0.333\height} {0.250\width} {0.333\height}, clip}{\includegraphics[width=8cm]{ulvyP.png}}};
\node[draw, thick, transform shape, canvas is xy plane at z=1, rotate=90] {\adjustbox{trim={0.250\width} {0.666\height} {0.500\width} {0.000\height}, clip}{\includegraphics[width=8cm]{ulvyP.png}}};
\end{tikzpicture}
\end{document}
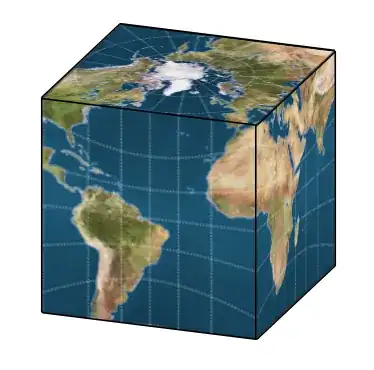
Image source: https://gis.stackexchange.com/questions/392282/why-does-cubemap-projection-preserve-lines-of-longitude-but-not-latitude


\includegraphicsthe picture instead of a digit in your slanted node? It's just a matter of resizing and trimming than (which could be automated a bit surely}. – Qrrbrbirlbel Oct 22 '22 at 22:12\includegraphicswould end up in an interminable hand ajustements of coordinates of the rectalgular image to fit the coordinates of the TikZ figure, just like the solution posted below. – TeX Apprentice Oct 23 '22 at 23:11