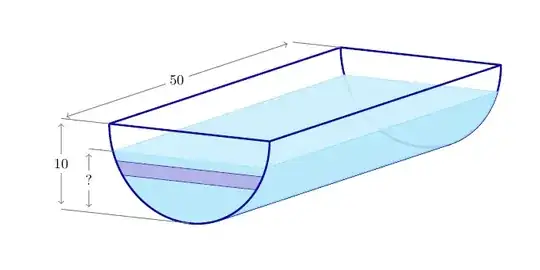
The drawing uses the package tikz-3dplot; it gives the very useful option canvas is xy plane at z=....
Remarks
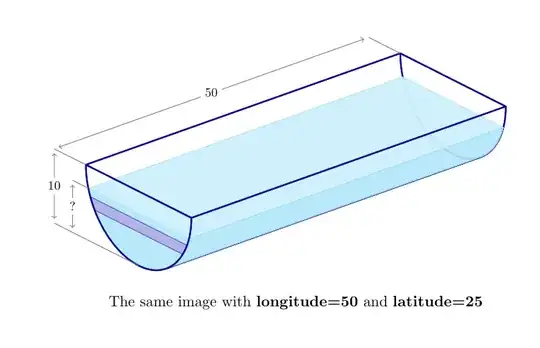
- I redefined the coordinate system (a question of taste). The point of view can be changed by modifying the longitude and/or latitude (see the image below). The drawing is consistent if the observer stays in the first quadrant, i.e. if her latitude and longitude are contained in the interval (0, 90).
- The elements composing the water tank are added from the background (negative z values) towards the foreground (z=0).
- I couldn't figure out from the question's drawing if the front strip should continue as a layer through the water. If necessary, the layer can be constructed using the same techniques.
- I didn't draw the sectional image on the right; I imagine it is a straightforward plane drawing. By the way, the 3d coordinates I'm using, "identify the Oxy plane with the screen. So the plane section is obtained by taking the elements having z=0.
The code
\documentclass[11pt, margin=23pt]{standalone}
\usepackage{tikz}
\usepackage{tikz-3dplot}
\usetikzlibrary{math, calc}
\begin{document}
\tikzset{%
  view/.style 2 args={% longitude / latitude
    z={({-sin(#1)}, {-cos(#1)sin(#2)})},
    x={({cos(#1)}, {-sin(#1)sin(#2)})},
    y={(0, {cos(#2)})},
    evaluate={%
      \tox={sin(#1)cos(#2)};
      \toy={sin(#2)};
      \toz={cos(#1)cos(#2)};
    }
  },
  w/.style={% water
    draw=cyan!40, fill=cyan!30, opacity=1, fill opacity=.9
  },
  w light/.style={% water, top face
    draw=cyan!35, fill=cyan!20, opacity=1, fill opacity=.95
  },
  tank/.style={% tank
    draw=blue!60!black, very thick, opacity=.95, line join=round
  },
  l/.style={draw=blue!50!gray, fill=blue!50!gray!40}
}
\tikzmath{
  real \r, \t, \aRG, \rw, \aw, \dl, \rl1, \rl2, \al1, \al2;
  \r = 2; % radius
  \t = 5\r; % tank's length
  \rw = .3\r; % controls the water's level
  \aw = {asin(\rw/\r)};
  \dl = 0.6\r; % for the lebels
  \rl1 = .4\r; % controls the layer's top level
  \rl2 = .55*\r; % controls the layer's bottom level
  \al1 = {asin(\rl1/\r)};
  \al2 = {asin(\rl2/\r)};
}
\begin{tikzpicture}[view={30}{11}, % latitude longitude
  every node/.style={scale=.8, text=black, text opacity=1},
  evaluate={\aRG = {atan2(-\tox, \toy)};}] % critical ruling's angle
% tank / back side
  \path[tank, canvas is xy plane at z=-\t] (180: \r) arc (180: 360: \r);
  \path[tank] ({\rcos(\aRG)}, {\rsin(\aRG)}, 0)
  -- ({\rcos(\aRG)}, {\rsin(\aRG)}, -\t);
% water
  \path[w, canvas is xy plane at z=0]
  ({180 +\aw}: \r) arc ({180 +\aw}: {360 -\aw}: \r) -- cycle;
  \path[w light, canvas is zx plane at y={-\rw}]
  (0, -{\rcos(\aw)}) -- (0, {\rcos(\aw)})
  -- (-\t, {\rcos(\aw)}) -- (-\t, -{\rcos(\aw)}) -- cycle;
  \path[w] ({\rcos(-\aw)}, {\rsin(-\aw)}, 0)
  {%
    [canvas is xy plane at z=0]
    -- ({-\aw}: \r) arc ({-\aw}: {\aRG}: \r)
  }{%
    [canvas is xy plane at z=-\t]
    -- ({\aRG}: \r) arc ({\aRG}: {-\aw}: \r)
  } -- cycle;
% layer
  \path[l, canvas is xy plane at z=0]
  ({180 +\al1}: \r) arc ({180 +\al1}: {180 +\al2}: \r)
  -- ({-\al2}: \r) arc ({-\al2}: {-\al1}: \r) -- cycle;
% tank / top and front side
  \path[tank, canvas is zx plane at y=0]
  (0, -\r) -- (0, \r) -- (-\t, \r) -- (-\t, -\r) -- cycle;
  \path[tank, canvas is xy plane at z=0] (180: \r) arc (180: 360: \r);
\draw[gray, line width=.5pt, canvas is xy plane at z=0]
  (0, -\r) -- ++(-\dl -\r, 0) node (T0) {}
  ({180 +\aw}: \r) -- ++(-.5*\dl, 0) node (W1) {}
  ++(0, -\r +\rw) node (W0) {}
  (-\r, 0) -- ++(-\dl, 0) node (T1) {};
  \draw[gray, line width=.5pt, canvas is xy plane at z=-\t]
  (-\r, 0) -- ++(-\dl, 0) node (T2) {};
  \path[canvas is zx plane at y=0]
  (T1) edge[gray, <->, line width=.5pt] node[pos=.5, fill=white] {$50$} (T2)
  edge[gray, <->, line width=.5pt] node[pos=.5, fill=white] {$10$} (T0)
  (W1) edge[gray, <->, line width=.5pt] node[pos=.5, fill=white] {$?$} (W0);
\end{tikzpicture}
\end{document}


clip(\clip) command. – Jasper Habicht Jan 20 '23 at 08:05