3

I have the following loss plot data in a csv file. With columns (a) Epochs, (b) Test_loss , (c) Train_loss and 10,000 row entries of this data (As 10,000 epochs in total). I want to plot this on a tikz format how to do so?

I have the format as ;

\documentclass[tikz, border=1cm]{standalone}
\usepackage{pgfplots}
\pgfplotsset{compat=1.18}
\begin{document}
\begin{tikzpicture}
\begin{loglogaxis}[
xmin=0, xmax=1e2,
ymin=1e-7, ymax=1e1,
xlabel={Number of Epochs}, 
ylabel={Normalized MSE: $\log_{10} (e)$ },
label style={font=\bfseries\boldmath},
tick label style={font=\bfseries\boldmath},
scatter/classes={a={mark=square*, blue}, b={mark=triangle*, red}, c={mark=o, black}},
]
\addplot[scatter, only marks,
scatter src=explicit symbolic]
table[meta=label] {
x     y      label
};
\end{loglogaxis}
\end{tikzpicture}
\end{document}

enter image description here.

My csv file looks like this.

Epochs,Test_loss,Train_loss

0,0.203095777,0.234712227

1,0.202614659,0.234308232

2,0.202137079,0.233968432

Link to the csv file: I have copied the first 20 rows of the 2000 row dataset in this file and named it as 3N5H_test.csv .

csv file link

  • 1
    Could you maybe add the first three or so lines of your CSV file? You may use modified values, but it would be good to know about the concrete format of the file. – Jasper Habicht Feb 05 '23 at 16:44
  • I am not sure to understand the question. Could https://tex.stackexchange.com/questions/248723/plot-large-data help? – Rmano Feb 05 '23 at 16:47
  • In the liked CSV file there is a BOM (byte order mark) at the beginning of the file (it is an invisible character that sits before the first visible character of the file). It is best to delete this BOM. To do this, place the cursor behind the first character of the file, press the left-arrow key only once, press delete at least twice, save the file. – Jasper Habicht Feb 06 '23 at 15:34
  • @JasperHabicht Hey, that actually works for the test file. But having memory issue for the 2000 row file. TeX capacity exceeded, sorry [main memory size=5000000]. – Formal_this Feb 06 '23 at 21:22
  • 1
    Maybe, as for the memory problem, some of the ideas linked here can help you: https://tex.stackexchange.com/q/319004/47927 – Jasper Habicht Feb 06 '23 at 21:23
  • Cool thanks a lot. – Formal_this Feb 06 '23 at 21:43

1 Answers1

6

I am unsure how your CSV file looks like, but guessing from what you describe, an easy approach could be as follows: I understand that you got a CSV file with a content similar to this:

Epoch, Test_loss, Train_loss, Test_metric
1,     0.02,      0.03,       0.025
1000,  0.01,      0.005,      0.015
...

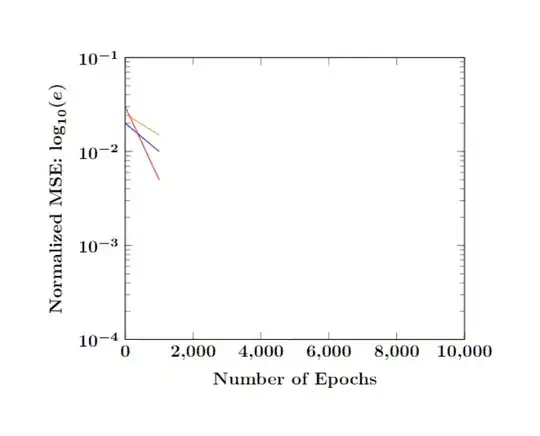
In this case, you can simply parse this by adding an \addplot macro for each of the columns that you want to plot, let x be the Epoch column and y the column with the relevant values:

\documentclass[tikz, border=1cm]{standalone}
\usepackage{pgfplots}
\pgfplotsset{compat=1.18}

% your CSV file: \begin{filecontents}{data.csv} Epoch, Test_loss, Train_loss, Test_metric 1, 0.02, 0.03, 0.025 1000, 0.01, 0.005, 0.015 \end{filecontents} % =====

\begin{document} \begin{tikzpicture} \begin{semilogyaxis}[ xmin=0, xmax=1e4, ymin=1e-4, ymax=1e-1, scaled x ticks=false, xlabel={Number of Epochs}, ylabel={Normalized MSE: $\log_{10} (e)$}, label style={font=\bfseries\boldmath}, tick label style={font=\bfseries\boldmath}, ] \addplot[scatter, no marks, draw=blue] table [x=Epoch, y=Test_loss, col sep=comma] {data.csv}; \addplot[scatter, no marks, draw=red] table [x=Epoch, y=Train_loss, col sep=comma] {data.csv}; \addplot[scatter, no marks, draw=orange] table [x=Epoch, y=Test_metric, col sep=comma] {data.csv}; \end{semilogyaxis} \end{tikzpicture} \end{document}

enter image description here

Of course, you don't need to include the CSV data in your TeX file. Just place the CSV file in the same directory where your TeX file is stored, and write, e.g., \addplot[scatter, no marks, draw=blue] table [...] {<file name>};. You can just ignore the stuff between \begin{filecontents}{data.csv} and \end{filecontents} (including these two lines) in this case, since this is just to make the above example compilable.


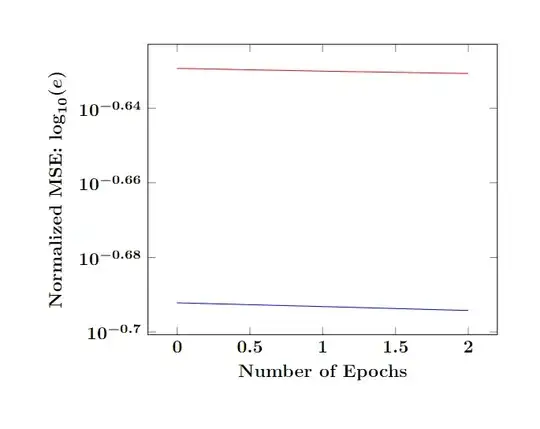
Sorry, I cannot really reproduce the problems you have. I adjusted the above example with the data you provided:

The file 3N5H.csv (note that there should probably be no empty lines in the CSV file, because these would be interpreted as (empty) data points):

Epochs,Test_loss,Train_loss
0,0.203095777,0.234712227
1,0.202614659,0.234308232
2,0.202137079,0.233968432

The TeX file:

\documentclass[tikz, border=1cm]{standalone}
\usepackage{pgfplots}
\pgfplotsset{compat=1.18}

\begin{document} \begin{tikzpicture} \begin{semilogyaxis}[ % xmin=0, xmax=1e4, % The output would not be visible otherwise % ymin=1e-4, ymax=1e-1, % The output would not be visible otherwise scaled x ticks=false, enlargelimits, xlabel={Number of Epochs}, ylabel={Normalized MSE: $\log_{10} (e)$}, label style={font=\bfseries\boldmath}, tick label style={font=\bfseries\boldmath}, ] \addplot[scatter, no marks, draw=blue] table [x=Epochs, y=Test_loss, col sep=comma] {3N5H.csv}; \addplot[scatter, no marks, draw=red] table [x=Epochs, y=Train_loss, col sep=comma] {3N5H.csv}; \end{semilogyaxis} \end{tikzpicture} \end{document}

Result:

enter image description here

  • Oh, I actually have 2000 data points in my csv file. Do I need to type all that? Can I not directly import it? – Formal_this Feb 05 '23 at 17:15
  • Yes you can. Just place the CSV inside the same directory and replace data.csv (for each \addplot) with the name of this file. You don't need to include the CSV data in your TeX file. The above is just to make a minimal working example. – Jasper Habicht Feb 05 '23 at 17:17
  • Thanks a lot for your explanation, I have updated my question with how my csv looks like. – Formal_this Feb 05 '23 at 18:49
  • Oh, I wasn't able to get the result . I tried table [x={Epoch}, y={Test_loss}, col sep=space] {3N5H.csv}; 3N5H.csv is the name of the csv file, stored in the same folder as the tex file. – Formal_this Feb 05 '23 at 19:50
  • @Formal_this From how the CSV looks like as you showed in your answer, it should be table [x={epochs}, y={Test loss}, col sep=comma] {3N5H.csv}. You need to use the exact column names from the CSV, which are typically the values in the first row of the CSV. Also, you should check what the column separator of your CSV really is. Open the CSV with a text editor and double check. It is most likely comma or tab. – Jasper Habicht Feb 05 '23 at 20:18
  • Yeah, i checked all that. This error is remaining ; – Formal_this Feb 05 '23 at 20:35
  • \protect l.17 ...s, y=Test_loss, col sep=comma] {3N5H.csv}; ^^M The control sequence marked should not appear between \csname and \endcsname.

    ! Missing number, treated as zero.

    E l.17 ...s, y=Test_loss, col sep=comma] {3N5H.csv}; ^^M A number should have been here; I inserted '0'. (If you can't figure out why I needed to see a number, look up `weird error' in the index to The TeXbook.
    – Formal_this Feb 05 '23 at 20:35
  • 1
    I added how the csv looks like – Formal_this Feb 05 '23 at 20:39
  • hey may you kindly help me on this. thanks a lot. – Formal_this Feb 06 '23 at 02:27
  • Hey Jasper, thanks a lot for all your help! In order to conclude the problem, I have added a csv file in my question, which I copied from my original file. May you kindly help me try to plot this and see if this works or not? Again thanks a lot for your help. I tried to plot this with your code and the plot appears but no point is visible. While the same code was throwing error for the 2000 row dataset. – Formal_this Feb 06 '23 at 15:17
  • @Formal_this After having deleted the BOM in the CSV you linked above (see my comment to your question about this), I was able to plot the data. Do you want to add marks for the single data points on the plot? – Jasper Habicht Feb 06 '23 at 15:43
  • No, I wish to have a continuous plot only. – Formal_this Feb 06 '23 at 15:52
  • Thanks a lot, actually that did work all well. But for 2000 rows, it shows TeX capacity exceeded, sorry [main memory size=5000000]. – Formal_this Feb 06 '23 at 21:14