4

Here I am using https://mermaid.live/ to create a flowcharts. For example with the following code:

flowchart TB
   subgraph w1
       A
       B
       C
   end
   subgraph w2
       D
       E
   end
   subgraph w3
       F
   end
   A & B & C --> D & E
   D & E --> F

It generates:


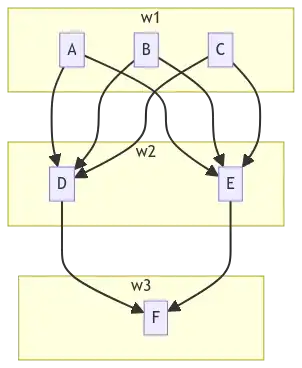
Looks like mermaid handles subgraphs as an array and generates boxes side by side.

It it possible to generate this example flowchart in tikz? if possible dynamically, where new nodes could be added in each subgraph like:

<A B C D E ...>
  <F G H ...>
  <Y Z ...>

The closest I was able to come up with is as follows, with the help from https://tex.stackexchange.com/a/357573/127048 :

\documentclass[tikz,border=2pt]{standalone}
\usepackage{tikz, tikzscale}
\usepackage{paralist} % compactitem
\usetikzlibrary{
    shapes.geometric,
    arrows,
    arrows.meta,
    calc,
    positioning,
    decorations.pathreplacing,
    calligraphy, % had to be after lib. decorations.pathreplacing
    bending} % add geometric shapes and arrows for flowcharts, plus calc package, positioning for relative positions
\tikzstyle{startstop} = [rectangle, rounded corners, minimum width=3cm, minimum height=1cm, text centered, draw=black, fill=white]
\tikzstyle{process} = [rectangle, minimum width=3cm, minimum height=1cm, text centered, draw=black, fill=white]
\tikzstyle{process2} = [rectangle, minimum width=3cm, minimum height=1cm, text centered, draw=black, fill=white]
\tikzstyle{process3} = [rectangle, minimum width=3cm, minimum height=1cm, text centered, draw=black, fill=white]
\tikzstyle{arrow} = [thick,->,>=stealth]

\begin{document} \begin{tikzpicture}[ transform shape, node distance = 22mm and 11mm, box/.style = {shape=rectangle, draw, thin, minimum height=10mm, text width=32mm, align=center, top color=#1!20, bottom color=#1!80, anchor=south west }, BC/.style args = {#1/#2/#3}{ % Braces Calligraphic decorate, decoration={calligraphic brace, amplitude=6pt, raise=#1, #2, % for mirroring of brace aspect=#3}, very thick }, ]

\node (start) [process, align=center] {A}; \node (pro1) [process, right of=start, align=center, xshift=2cm] {B}; \node (pro2) [process, right of=pro1, align=center, xshift=2cm] {C}; \node (pro3) [process2, below of=start, align=center, yshift=-.5cm] {D}; \node (pro4) [process2, below of=pro2, yshift=-.5cm] {E}; \node (main) [startstop, below of=pro1, yshift= -2cm, fill=black!30] {F}; \draw[-Stealth] (start) edge (pro3) (start) edge (pro4) (pro1) edge (pro3) (pro1) edge (pro4) (pro2) edge (pro3) (pro2) edge (pro4) (pro3) edge (main) (pro4) edge (main) \end{tikzpicture} \end{document}

output:

enter image description here

alper
  • 1,389
  • 1
    Here's an example with backgrounds: https://texample.net/tikz/examples/system-combination/ . I suggest to look up some statements used in the tikz manual http://mirrors.ctan.org/graphics/pgf/base/doc/pgfmanual.pdf , especially the tikzlibrary/ies . Also have a search for "bend" to become the bender of your connectors. – MS-SPO Feb 14 '23 at 17:36
  • 1
    The graphs library (for input syntax) would allow something like {A, B, C} -> [complete bipartite] {D, E} -> F for specifing the edges. The graphdrawing library (need Lua!) with its layered library would help in placing the nodes automatically. There's also sublayouts for the yellow boxes. – Qrrbrbirlbel Feb 14 '23 at 17:42
  • @Qrrbrbirlbel I haven't used Lua before. Is https://tikz.dev/gd-overview correct way to start to learn from? – alper Feb 14 '23 at 20:46
  • 1
    @alper Correct. Don't forget to read about the graphs library as well. It doesn't do anything you can't do with nodes and edges already but the graphdrawing library kinda depends on it (and all the examples use it). – Qrrbrbirlbel Feb 14 '23 at 20:59
  • On second thought, if its always that straight forward (only two dimensions), you could use my \tikzMatrixNodes with a few adjustments. – Qrrbrbirlbel Feb 14 '23 at 21:31

2 Answers2

6

The most automatic approach without implementing something new is in my opinion a combination of the graphs library and the graphdrawing library (need Lua) with its layered sublibrary.

The name / text[options] // … syntax describes a sublayout with the name name and its text text. Unfortunately, the implementation of the text label is somewhat bare which is why I've used subgraph text none (i.e. w1, w2 and w3 won't show up anywhere) and using an good old label for giving the sublayout a, well, label.

It appears as if the sublayouts are added very late which means they will cover any containing nodes and edges. This is why I give them each a proper name I can access at the end of the picture.

While there might be away to hack the node operation to be put on a different layer than the current for this simple example I'd go with the tried and tested approach.


For a more automatic approach take a look at \tikzsimpleflowchart:

\tikzsimpleflowchart{{A, B, C, D, E}, {F, G, H}, {I}, {J, K}}

This won't allow the ... (e.g. A, ..., E), for that, more work is needed.

The ext.node-families library allows you to put all sublayout nodes in one family of the same width, though this will need two compilation runs.

The \cnt macro is not available when the label (or the options of the sublayout) are processed which is why I have added them in the last step.

Code

\documentclass[tikz]{standalone}
\usetikzlibrary{graphdrawing, graphs, quotes, backgrounds}
\usetikzlibrary{ext.node-families}
\usegdlibrary{layered}
\pgfqkeys{/utils/count list}{.style 2 args={/utils/exec=\def#2{0},
  /utils/temp/.code=\edef#2{\pgfinteval{#2+1}},/utils/temp/.list={#1}}}
\tikzset{
  flowchart/nodes/.style={
    draw=blue!25!red, fill=blue!50!red!50,
    text width=width("$M$"), align=center},
  flowchart/boxes fg/.style={outer sep=+0pt, /tikz/node family/width=sublayout},
  flowchart/boxes bg/.style={draw=yellow!50!black, fill=yellow!20}}
\newcommand*\tikzsimpleflowchart[2][]{%
\begin{tikzpicture}[
  subgraph nodes={/tikz/flowchart/boxes fg},
  subgraph text none, label position=left,
  /utils/count list={#2}{\itemsinlist},#1]
\graph[math nodes, nodes={/tikz/flowchart/nodes}, layered layout]{
  \foreach[
    count=\cnt,
    remember=\listitem as \lastitem (initially )]\listitem in {#2}{
    w\cnt //[layered layout]{[parse/.expand once=\listitem]},
    {[parse/.expand once=\lastitem]}
      ->[complete bipartite]
        {[parse/.expand once=\listitem]}}};
\scoped[on background layer]\foreach \cnt in {1,...,\itemsinlist}
  \path[flowchart/boxes bg]
    (w\cnt.south west) rectangle (w\cnt.north east)
    [late options={name=w\cnt,label=$w_{\cnt}$}];
\end{tikzpicture}}

\begin{document} \begin{tikzpicture}[ subgraph nodes={outer sep=+0pt}, subgraph text none, label position=left] \graph[ math nodes, nodes={draw=blue!25!red, fill=blue!50!red!50}, layered layout ]{ w1["$w_1$"] //[layered layout] {A, B, C}, w2["$w_2$"] //[layered layout] {D, E}, w3["$w_3$"] //[layered layout] {F}; {A, B, C} ->[complete bipartite] {D, E} -> F }; \scoped[on background layer]\foreach \w in {1,...,3} \path[draw=yellow!50!black, fill=yellow!20] (w\w.south west) rectangle (w\w.north east); \end{tikzpicture} \tikzsimpleflowchart{{A, B, C, D, E}, {F, G, H}, {I}, {J, K}} \end{document}

Output

enter image description here enter image description here

Qrrbrbirlbel
  • 119,821
  • Adding \usetikzlibrary{ext.node-families} to the preamble and /tikz/node family/width = X to the subgraph nodes and compiled twices results in same-sized sublayouts. – Qrrbrbirlbel Feb 14 '23 at 21:18
  • the arrows looks like behind the box's gray color border. Is it possible to show arrows above the rectangle's border? – alper Feb 15 '23 at 12:55
  • 1
    @alper I've updated my answer that incorporates your point and I've also added a \tikzsimpleflowchart macro that more or less creates these diagrams a bit more automatic. – Qrrbrbirlbel Feb 16 '23 at 17:20
  • The output crashs show following output: `/tikz/,/tikz/graphs/

    conversions/canvas coordinate/.code=1 , conversions/coordinate/.code=1

    layered` and followed by https://gist.github.com/avatar-lavventura/48839411de77abf3a8bc56722b504950?permalink_comment_id=4486144#gistcomment-4486144 is it normal?

    – alper Feb 27 '23 at 20:43
  • @alper Are you using LuaLaTeX? As I said before, it should be possible to do the same without Lua/graphs since your diagram is fairly simple. – Qrrbrbirlbel Feb 27 '23 at 21:36
3

Another basic solution that also works with the pdfLaTeX engine:

\documentclass[margin=3mm]{standalone}
\usepackage{tikz}
\usetikzlibrary{arrows.meta,
                backgrounds,
                fit,
                positioning}

\begin{document} \begin{tikzpicture}[ node distance = 7mm and 7mm, N/.style = {draw, draw=purple, fill=purple!30, minimum size=5mm, inner sep =1mm}, FIT/.style = {draw, draw=yellow, fill=yellow!30, inner sep=2mm, fit=#1},
every edge/.append style = {-{Straight Barb[scale=0.8]}, semithick} ] \node[N] (w11) {A}; \node[N, right=of w11] (w12) {B}; \node[N, right=of w12] (w13) {B}; % \begin{scope}[node distance = 7mm and 0mm] \node[N, below right=of w11] (w21) {C}; \node[N, below right=of w12] (w22) {D}; % \node[N, below right=of w21] (w31) {E}; \end{scope} % \begin{scope}[on background layer] \node[FIT=(w11) (w13), label=left:$w1$] {}; \node[FIT=(w21) (w22), label=left:$w2$] {}; \node[FIT=(w31), label=left:$w3$] {}; \end{scope} \foreach \i in {1,2,3} { \draw (w1\i) edge (w21); \draw (w1\i) edge (w22); \ifnum\i<3 \draw (w2\i) edge (w31); \fi } \end{tikzpicture} \end{document}

enter image description here

projetmbc
  • 13,315
Zarko
  • 296,517
  • Here when I write additonal text after the \end{tikzpicture} it writes next to it. Can we write normal text after a newline? – alper Feb 27 '23 at 07:27
  • In answer is used standalone document class, which is primarily intended for drawing of images and (therefore) not enable to write additional text. It is not clear, what is purpose of this text. If it is part of image, than include it inside of image. Anyway, see what happens, if you to standalone add option varwidth . Otherwice, replace standalone with article, for example. – Zarko Feb 27 '23 at 07:42
  • I was trying to make a documentation file where text will be used to explain the drawing but text will not be part of the image. Replacing \documentclass{article} was what I was looking for but when now text right margin is goes till end of the page – alper Feb 27 '23 at 08:36
  • @alper, I'm just curries, You accept another answer, but ask me for further help? BTW, if you have new problem, please ask new question where with MWE explain what is your new problem. – Zarko Feb 27 '23 at 12:51
  • I appreciate your valuable answer, it works solid, thank you . – alper Feb 27 '23 at 20:44