3

I want to create the following tikzpicture:

enter image description here

What I have at the moment is this:

\documentclass{article}
\usepackage[showframe]{geometry}
\usepackage{tikz}
\usetikzlibrary{positioning,backgrounds}
\begin{document}
\noindent\begin{tikzpicture}[background rectangle/.style={fill=gray!25}, show background rectangle,every node/.style={inner sep=0pt,outer sep=0pt,draw}]

\begin{scope}[local bounding box=scope1] \path[use as bounding box] (0,0) rectangle (.5\textwidth,0); \filldraw (0,0) circle (2pt); \node text width=0.5\textwidth, align=left,anchor=north west {scope 1, node 1}; \node [below = 0pt of n1.south west,anchor=north west] (n2) {scope 1, node 2}; \node [below left = 0pt and 0pt of n2.north east,anchor=north west,align=left,text width=5.1cm] (n3) {scope 1, node 3 that includes longer text to be broken into lines}; \end{scope}

\begin{scope}[shift={(scope1.north east)},anchor=north west] \node text width=0.5\textwidth, align=left {scope 2, node 1}; \node [below = 0pt of n1.south west,anchor=north west] (n2) {scope 2, node 2}; \node [below left = 0pt and 0pt of n2.north east,anchor=north west,align=left,text width=5.1cm] (n3) {scope 2, node 3 which also includes longer text to be broken into lines}; \end{scope}

\end{tikzpicture} \end{document}

enter image description here

I need help with two things:

  1. How can I define the width of node n3 so the total width of n2 and n3 is that of n1 (which is .5\textwidth)? At the moment I set it to 5.1cm because it looks ok but if I change the content of node 2 then node 3's dimension should change as well. How can I make use of the bounding box I created for the first scope?

  2. How can I insert a separator between the two scopes (such as the one drawn in yellow in the first pic)? Why the width of the two scopes extends beyond textwidth? There is a gray margin on the left and right although outer sep=0pt.

tush
  • 1,115
  • The background rectangle has a padding (whch is called inner frame [xy]sep), thus it shows more in gray than your actual content. Use tight background to change this. Furthermore, the line width (of any path, not only nodes, irregardles of any outer seps) will contribute to the picture's final bounding box which also throws off the final placement of the picture a bit (and will lead to an overful hbox). In your current setup, you can overcome this with trim left=0pt, trim right=\textwidth. – Qrrbrbirlbel Mar 16 '23 at 18:55
  • @Qrrbrbirlbel I am aware of the line width, yet this visible inner frame is still an order of magnitude larger than the line widths so I was curious about it. – tush Mar 16 '23 at 18:57
  • For creating nodes that have sizes that are relating to other nodes, they are the fit library which works by setting text width/height/depth which is bad if you want the nodes to actually have text. My ext.positioning-plus library does similar things using the fit library but controls the size of the new node by using minimum width and minimum height which is better for having text in the node but needs a bit work for text that is longer than what would fit in the node. For syncing up sizes of nodes, I can offer ext.node-families. – Qrrbrbirlbel Mar 16 '23 at 19:01

4 Answers4

3

The background rectangle has a padding (whch is called inner frame [xy]sep), thus it shows more in gray than your actual content. Use tight background to change this.
Furthermore, the line width (of any path, not only nodes, irregardles of any outer seps) will contribute to the picture's final bounding box which also throws off the final placement of the picture a bit (and will lead to an overful hbox).
In your original setup, you can overwrite the bounding box's horizontal measurement by using trim left=0pt, trim right=\textwidth. In my code below, I'm using ±.5\textwidth because I create the picture centered about the origin.

For creating nodes that have sizes that are relating to other nodes, they are the fit library which works by setting text width/height/depth which is bad if you want the nodes to actually have text.

My ext.positioning-plus library does similar things using the fit library but controls the size of the new node by using minimum width and minimum height which is better for having text in the node but needs a bit work for text that is longer than what would fit in the node.

I'm using here a very basic text width between key that uses the calc library to measure the distance between two arbitrary points in the x dimension and uses that to set the text width of the node. We need to subtract inner xsep twice here (so that the final node actually covers the area with inner xsep). This is basically a way to set a fixed width instead of a minimum width. (The factor 2 is different for other shapes.)

For syncing up sizes of nodes, I can offer the ext.node-families library of my tikz-ext package.

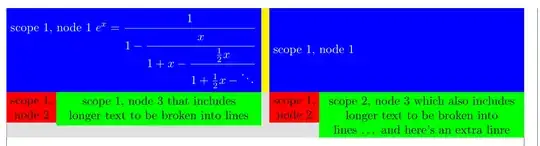
Every node that has node family={height=row1} set shares the same minimum height. This will align the texts in each node vertically centered.

Both blue nodes as well as the yellow separater (also a node) will span the same vertical space.

Code (Node Family)

\documentclass{article}
\usepackage[showframe]{geometry}
\usepackage{tikz, amsmath}
\makeatletter % https://tex.stackexchange.com/a/656319/16595
\tikzset{parse let/.code={\def\tikz@cc@stop@let in{}\tikz@let@command et #1in}}
\makeatother
\usetikzlibrary{calc, positioning, backgrounds, ext.node-families}
\tikzset{
  text width between/.style args={#1 and #2}{
    parse let={\p@=($(#2)-(#1)$)},
    text width/.expanded={abs(\x@)-2*(\noexpand\pgfkeysvalueof{/pgf/inner xsep}}}}
\begin{document}
\noindent
\begin{tikzpicture}[
  background rectangle/.style={fill=gray!25},
  show background rectangle, tight background,
  trim left=-.5\textwidth, trim right=.5\textwidth,
  every node/.style={outer sep=+0pt},
  Yellow/.style={fill=yellow, node family={height=row1}},
  Blue/.style  ={fill=blue,   node family={height=row1}, text=white},
  Red/.style   ={fill=red,   align=center},
  Green/.style ={fill=green, align=center},
  node distance=+0pt
]
\node[Yellow] (sep) {};
\node[Blue, left=of sep,  text width between={-.5\textwidth,0 and sep.west}]
  (Blue-left) {scope 1, node 1 $\displaystyle e^x = \cfrac{1}{1 - \cfrac{x}{1 + x -
                               \cfrac{\frac{1}{2}x}{1 + \frac{1}{2}x - \ddots}}}$};
\node[Blue, right=of sep, text width between={ .5\textwidth,0 and sep.east}]
  (Blue-right) {scope 1, node 1};

\node[Red, below right=of Blue-left.south west] (Red-left) {scope 1,\ node 2}; \node[Red, below right=of Blue-right.south west] (Red-right) {scope 1,\ node 2};

\node[Green, below left=of Blue-left.south east, text width between=Red-left.east and Blue-left.east] (Red-left) {scope 1, node 3 that includes longer text to be broken into lines};

\node[Green, below left=of Blue-right.south east, text width between=Red-right.east and Blue-right.east] (Red-left) {scope 2, node 3 which also includes longer text to be broken into lines \dots\ and here's an extra linre}; \end{tikzpicture} \end{document}

Code (w/o Node Family)

\documentclass{article}
\usepackage[showframe]{geometry}
\usepackage{tikz, amsmath}
\makeatletter % https://tex.stackexchange.com/a/656319/16595
\tikzset{parse let/.code={\def\tikz@cc@stop@let in{}\tikz@let@command et #1in}}
\makeatother
\usetikzlibrary{calc, positioning, backgrounds}
\tikzset{
  text width between/.style args={#1 and #2}{
    parse let={\p@=($(#2)-(#1)$)},
    text width/.expanded={abs(\x@)-2*(\noexpand\pgfkeysvalueof{/pgf/inner xsep}}},
  minimum height of three nodes/.style n args={3}{
    parse let={\p1=($(#1.north)-(#1.south)$),
               \p2=($(#2.north)-(#2.south)$),
               \p3=($(#3.north)-(#3.south)$),
               \n@={max(\y1,\y2,\y3)}},
    minimum height/.expanded={\n@}}}
\DeclareDocumentCommand{\tikzthreenodessameheight}{O{} m O{} m O{} m}{
  \node[#1,alias=@1,overlay,path only,outer ysep=+0pt]{\phantom{#2}};
  \node[#3,alias=@2,overlay,path only,outer ysep=+0pt]{\phantom{#4}};
  \node[#5,alias=@3,overlay,path only,outer ysep=+0pt]{\phantom{#6}};
  \node[#1,minimum height of three nodes={@1}{@2}{@3}] {#2};
  \node[#3,minimum height of three nodes={@1}{@2}{@3}] {#4};
  \node[#5,minimum height of three nodes={@1}{@2}{@3}] {#6};}
\begin{document}
\noindent
\begin{tikzpicture}[
  background rectangle/.style={fill=gray!25},
  show background rectangle, tight background,
  trim left=-.5\textwidth, trim right=.5\textwidth,
  every node/.style={outer sep=+0pt},
  Yellow/.style={fill=yellow},
  Blue/.style  ={fill=blue,   text=white},
  Red/.style   ={fill=red,   align=center},
  Green/.style ={fill=green, align=center},
  node distance=+0pt
]
\tikzthreenodessameheight
  [Yellow, name=sep]{}
  [Blue, left=of sep, name=Blue-left,
   text width between={-.5\textwidth,0 and sep.west}]
  {scope 1, node 1 $\displaystyle e^x = \cfrac{1}{1 - \cfrac{x}{1 + x -
                          \cfrac{\frac{1}{2}x}{1 + \frac{1}{2}x - \ddots}}}$}
  [Blue, right=of sep, text width between={ .5\textwidth,0 and sep.east}, name=Blue-right]
  {scope 1, node 1};

\node[Red, below right=of Blue-left.south west] (Red-left) {scope 1,\ node 2}; \node[Red, below right=of Blue-right.south west] (Red-right) {scope 1,\ node 2};

\node[Green, below left=of Blue-left.south east, text width between=Red-left.east and Blue-left.east] (Red-left) {scope 1, node 3 that includes longer text to be broken into lines};

\node[Green, below left=of Blue-right.south east, text width between=Red-right.east and Blue-right.east] (Red-left) {scope 2, node 3 which also includes longer text to be broken into lines \dots\ and here's an extra linre}; \end{tikzpicture} \end{document}

Output

enter image description here

Qrrbrbirlbel
  • 119,821
  • Do you know of a way to achieve this without your external package? – tush Mar 16 '23 at 19:54
  • @tush I've added a version without the ext.node-families library, see the \tikzthreenodessameheight macro which typesets the three nodes but doesn't show them and then again but this time it uses the maximum height of all of them for the height. If the node text contains manual \\ or other stuff that doesn't work with \phantom different approaches must be taken. – Qrrbrbirlbel Mar 16 '23 at 20:24
  • Can I send you a private message? Via what medium? – tush Mar 16 '23 at 20:30
  • @tush Private? No. But this site has chat rooms where you can create a new one. – Qrrbrbirlbel Mar 16 '23 at 20:49
3

With a tcbraster (or tcbitemize) from tcolorbox, we can leave the package to do all the work for us. The rasteruse\texwidth` by default, every raster column has equal width but it's also possible to adjust them manually.

\documentclass{article}
\usepackage[showframe]{geometry}
\usepackage[most]{tcolorbox}

\begin{document}

\begin{tcbitemize}[raster every box/.style={sharp corners,
fontupper=\sffamily, colupper=white, boxrule=0pt, halign=center}, raster left skip=0pt, raster right skip=0pt, raster before skip=0pt, raster row skip=0pt, raster after skip=0pt, raster valign=top] \tcbitem[colback=blue!90!black] scope 1, node 1 \tcbitem[colback=blue!90!black] scope 2, node 1 \tcbitem[blankest, raster column skip=0pt] \begin{tcbitemize}[raster force size=false] \tcbitem[colback=red!90!black, width=.4\linewidth] scope 1, node 2 \tcbitem[colback=green!90!black, width=.6\linewidth] scope 1, node 3 that includes longer text to be broken into lines \end{tcbitemize} \tcbitem[blankest, raster column skip=0pt] \begin{tcbitemize}[raster force size=false] \tcbitem[colback=red!90!black, width=.4\linewidth] scope 2, node 2 \tcbitem[colback=green!90!black, width=.6\linewidth] scope 2, node 3 which also includes longer text to be broken into lines \end{tcbitemize} \end{tcbitemize} \end{document}

enter image description here

Ignasi
  • 136,588
3

enter image description here

I tried to stay close to your initial code. There is one issue not considered though: What happens if the height of the right top node is bigger than the height of the left top node. A solution might be to reverse the construction and the top right node to be the reference.

The code

\documentclass{article}
\usepackage[showframe]{geometry}
\usepackage{lipsum}
\usepackage{tikz}
\usetikzlibrary{calc, positioning}

\begin{document}

\lipsum[1] \bigskip

\tikzset{% T/.style={blue!50!black, fill=blue!50!black, text=white, minimum width=0.48\textwidth, text width=0.48\textwidth-1ex }, BW/.style={green!50!black, fill=green!70!black, text=black, minimum width=0.17\textwidth, text width=0.17\textwidth-1ex }, BE/.style={red!75!black, fill=red!95!black, text=black, minimum width=0.30\textwidth, text width=0.30\textwidth-1ex, } } \noindent\begin{tikzpicture}[% every node/.style={draw, inner sep=1ex, outer sep=0pt, align=center, minimum height=7ex} ] \node[T, anchor=north west] at (0, 0) (nTW) {\bfseries \lipsum[2]}; \node[BW, below=0pt of nTW.south west, anchor=north west] (n2) {scope 1, node 2}; \node[BE, below left=0pt and 0pt of n2.north east, anchor=north west] (n3) {scope 1, node 3 that includes longer text to be broken into lines};

\path ($(nTW.south) -(nTW.north)$); \pgfgetlastxy{\newW}{\newH}

\node[T, right=.02\textwidth of nTW.north east, anchor=north west, minimum height={-\newH}] (nTE) {\bfseries scope 2, node 1}; \node[BW, below=0pt of nTE.south west, anchor=north west] (n2E) {scope 2, node 2}; \node[BE, below left=0pt and 0pt of n2E.north east, anchor=north west] (n3E) {scope 2, node 3 that includes longer text to be broken into lines; can be longer than the West corresponding node};

\fill[yellow!90!red] (nTW.north east) rectangle (nTE.south west); \end{tikzpicture} \end{document}

Daniel N
  • 5,687
2

Alternative suggestion. My code is less technical (but perhaps also less elegant?).

You can adjust the width of the yellow separator (\yellowGap in my code), and the percentage of the width of the node 1 (percentAmount, an integer between 0 and 100, but it's better to not choose value too close to 0 or 100 to avoid very narrow columns), to obtain the width of the node 2.

Lastly, you can adjust the lenght of the inner sep in the nodes, \innerXSep.

\documentclass[a4paper,10pt]{article}
\usepackage[showframe]{geometry}
\usepackage[x11names]{xcolor}
\usepackage{tikz}
\usetikzlibrary{calc}
\usepackage{calc}

\newlength{\yellowGap} \setlength{\yellowGap}{3mm} \newcounter{percentAmount} \setcounter{percentAmount}{40}% =40% of the width of the first node. Value needs to be integer \newlength{\innerXSep} \setlength{\innerXSep}{.3333em}% default value

\newlength{\mainNodeWidth} \setlength{\mainNodeWidth}{(\textwidth-\yellowGap)/2} \newlength{\secondNodeWidth} \setlength{\secondNodeWidth}{\mainNodeWidth*\value{percentAmount}/100} \newlength{\thirdNodeWidth} \setlength{\thirdNodeWidth}{\mainNodeWidth-\secondNodeWidth}

\begin{document}

\noindent\begin{tikzpicture}[outer sep=0pt,inner xsep=\innerXSep,text=white] \node[text width=\mainNodeWidth-2\innerXSep,fill=DodgerBlue3,align=center] (mainLeft) {Scope 1, Node 1}; \node[text width=\secondNodeWidth-2\innerXSep,fill=Firebrick2,align=center,anchor=north west] (secondLeft) at (mainLeft.south west) {Scope 1,\Node 2}; \node[text width=\thirdNodeWidth-2\innerXSep,fill=Green3,align=center,anchor=north west] (thirdLeft) at (secondLeft.north east) {Scope 1, Node 3\ that includes longer text to be broken into lines}; \fill[DarkGoldenrod1] (mainLeft.north east) rectangle ($(mainLeft.south east)+(\yellowGap,0)$); \node[text width=\mainNodeWidth-2\innerXSep,fill=DodgerBlue3,align=center,anchor=north west] (mainRight) at ($(mainLeft.north east)+(\yellowGap,0)$) {Scope 2, Node 1}; \node[text width=\secondNodeWidth-2\innerXSep,fill=Firebrick2,align=center,anchor=north west] (secondRight) at (mainRight.south west) {Scope 2,\Node 2}; \node[text width=\thirdNodeWidth-2\innerXSep,fill=Green3,align=center,anchor=north west] at (secondRight.north east) {Scope 2, Node 3\ which also includes longer text to be broken into lines}; \end{tikzpicture} \end{document}

enter image description here

quark67
  • 4,166