Edit:
You should be aware that `pgfplots is not dedicated math programs as are Mathematica, Matlab and others, but is powerful tool for drawing of diagrams with (La)Tex.
To downvoter: I don't see any rational explanation what is wrong with my answer, for doing this. What I missed in it? Any explanation from anyone is welcome!
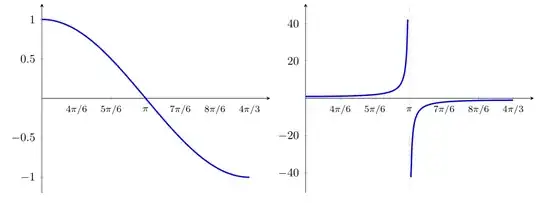
For the first two diagrams in your question try the following:
\documentclass[margin=3mm]{standalone}
\usepackage{pgfplots}
\pgfplotsset{compat=1.18}
\begin{document}
\pgfplotsset{ % common axis settings
trig format=rad, % <--- added
axis lines=center,
enlarge x limits = {0.1, upper},% <--- added
enlarge y limits = 0.1, % <--- added
xtick={4*pi/6,5*pi/6,...,9*pi/6}, % <--- added
xticklabels={$4\pi/6$,$5\pi/6$,$\pi$,
$7\pi/6$,$8\pi/6$,$4\pi/3$}, % <--- added
% xticklabels={120,150,180,210,240},
xticklabel style={minimum height=3.3ex,
font=\footnotesize}, % <--- added
samples = 200, % <------ increased number of sample
no marks,
restrict y to domain=-100:100, % <------
every axis plot post/.append style={very thick}, % <--- added
}
\begin{tikzpicture}[baseline] % both pictures are aligned to baseline \begin{axis}
\addplot +[domain=pi/2:3*pi/2] { sin(x) };
\end{axis}
\end{tikzpicture}
\begin{tikzpicture}[baseline]
\begin{axis}[
extra x ticks={pi},
extra tick style={grid=major, densely dashed, xticklabel={\empty}},
]
\addplot +[domain=pi/2:3*pi/2] { 2*pi/sin(x) };
\end{axis}
\end{tikzpicture}
\end{document}
Main changes in the above code in comparison to code of your MWE are:
- Removed
smooth option.
- Increased is number of samples. Ba this is increased accuracy of function calculations.
- To the code for the second diagram is added
restrict y to domain=-100:100 for restricting calculation of function until its values are smaller than set y limits (-100,+100). By this its calculation closer to x = 1 is skipped.
- Since calculation of functions consider argument in radians,
xtick labels are in radians too, however you can changes them to degrees (as do code commented code line below xtickclabels = ...) just uncomment code line xticklabels={120,150,180,210,240}.
For diagram added in addendum in your question is not entirely clear, what is problem with it and what you expect that it should present. It is actually shifted and inverted second diagram. Anyway, added to proposed MWE in form:
\begin{tikzpicture}[baseline]
  \begin{axis}[
        extra x ticks={1}, % for marking function pol
        %extra x ticks label={1},
        extra tick style={grid=major, densely dashed},
              ]
    \addplot +[domain=1/2:3/2] {3.28987-3.28987*x+2/(x-1) };
  \end{axis}
\end{tikzpicture}
gives the following result:
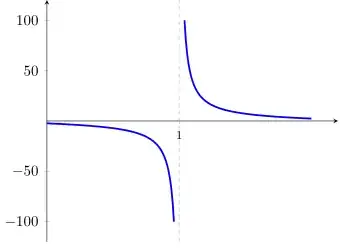
I this what you after?


domain=1/2:.9anddomain=1.1:3/2. – Teepeemm Mar 29 '23 at 01:57