I have a document with a custom font montserrat. I also have the following plot:
\documentclass[a4paper]{standalone}
\usepackage[extralight,defaultfam,light,tabular,lining]{montserrat} % Font
% For bar chart
\usepackage{pgfplots}
\begin{document}
\begin{tikzpicture}
\begin{axis}[
ymajorgrids=true,
scale only axis,
xtick={1,2,3,4,5},
xticklabels={Foo,Bar,Baz,FooBar,FooBaz},
every axis plot/.append style={
ybar,
bar width=20,
bar shift=0pt,
fill
},
ymin=0,
]
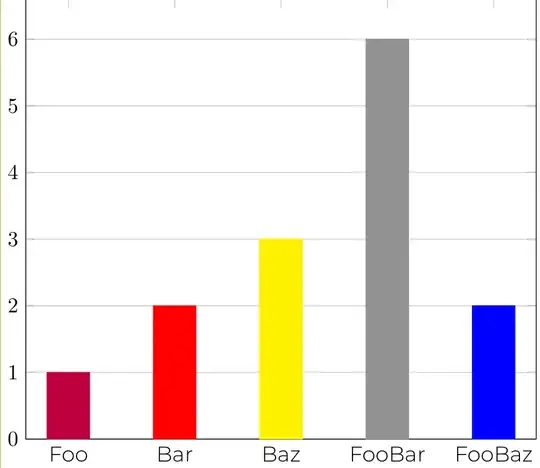
\addplot[purple] coordinates {(1,1)};
\addplot[red] coordinates {(2,2)};
\addplot[yellow] coordinates {(3,3)};
\addplot[gray] coordinates {(4,6)};
\addplot[blue] coordinates {(5,2)};
\end{axis}
\end{tikzpicture}
\end{document}
Unfortunately, only the x axis seems to adapt to the montserrat font, i.e., the y axis still has the default latex font. How can I get the y axis to be displayed in the montserrat font as well?


\usepackage[italic]{mathastext}after\usepackage[...]{montserrat}. – Henri Menke Mar 31 '23 at 09:06