6

In this code, I draw a regular polyhedron whose base is an equilateral triangle.

 \documentclass[tikz,border=3mm]{standalone}
\usepackage{tikz-3dplot} 
\begin{document}
    \tdplotsetmaincoords{70}{100}
    \begin{tikzpicture}[tdplot_main_coords,line cap=butt,line join=round,c/.style={circle,fill,inner sep=1pt},
        declare function={r=3;r1=2;h=3;}]
        \path
        ({r*cos(0)},{r*sin(0)},0) coordinate (A)
        ({r*cos(120)},{r*sin(120)},0) coordinate (B)
        ({r*cos(240)},{r*sin(240)},0) coordinate (C)
        ({r1*cos(0)},{r*sin(0)},h) coordinate (D)
    ({r1*cos(120)},{r1*sin(120)},h) coordinate (E)
    ({r1*cos(240)},{r1*sin(240)},h) coordinate (F);
\draw  (C)-- (A)--(B) 
(D)--(E)--(F)--cycle
(A) -- (D) (B) --(E) (C) -- (F)
; 
\draw [dashed] (C) -- (B);
    \end{tikzpicture}
\end{document}

enter image description here

How can I generalize this code, with two bases are n - regular polygon?

Ingmar
  • 6,690
  • 5
  • 26
  • 47

3 Answers3

12

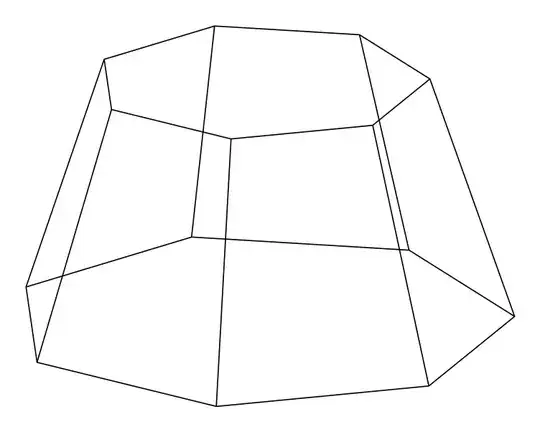
There is an easy way to place all the coordinates with a \foreach loop. The figure can be drawn this way too, but you'll lose the visibility.

For example:

\documentclass[tikz,border=3mm]{standalone}
\usepackage{tikz-3dplot}
\usetikzlibrary{3d} % for 'canvas is...' options

\begin{document} \tdplotsetmaincoords{70}{100} \pgfmathsetmacro\n{7} % number of sides \begin{tikzpicture}[tdplot_main_coords,line cap=butt,line join=round,%c/.style={circle,fill,inner sep=1pt}, declare function={r=3;r1=2;h=3;}] \foreach\i in {1,...,\n} { \coordinate (A\i) at (360\i/\n:r); \coordinate[canvas is xy plane at z=h] (B\i) at (360\i/\n:r1); \draw (A\i) -- (B\i); } \foreach\i in {A,B} \draw (\i1) foreach\j in {2,...,\n} {-- (\i\j)} -- cycle; \end{tikzpicture} \end{document}

enter image description here

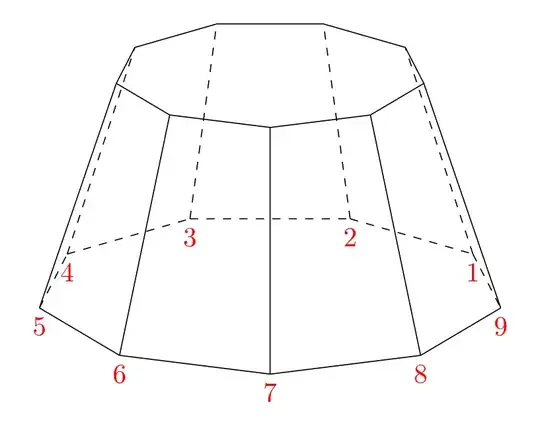
Update 1 (a little help with the visibility): rotate the figure so that the vertex A1 be the first non-visible vertex on the right. Then set \vl as the number of the first visible vertex on the left. The rest is 'automatic'.

\documentclass[tikz,border=3mm]{standalone}
\usepackage{tikz-3dplot}
\usetikzlibrary{3d} % for 'canvas is...' options

\begin{document} \tdplotsetmaincoords{70}{10} % <--- rotation \pgfmathsetmacro\n{9} % number of sides \pgfmathsetmacro\vl{5} % visibility limit \pgfmathtruncatemacro\vv{\vl+1} \begin{tikzpicture}[tdplot_main_coords,line cap=butt,line join=round, declare function={r=3;r1=2;h=3;}] \foreach\i in {1,...,\n} { \coordinate (A\i) at (360\i/\n:r); \coordinate[canvas is xy plane at z=h] (B\i) at (360\i/\n:r1); \pgfmathtruncatemacro\ii{\i+1} \draw[\ifnum\i<\vl dashed\fi] (A\i) -- (B\i); } \draw (B1) foreach\j in {2,...,\n} {-- (B\j)} -- cycle; \foreach\j in {1,...,\n} \pgfmathtruncatemacro\i{mod(\j,\n)+1} \draw[\ifnum\i<\vv dashed\fi] (A\i) -- (A\j); % only for help: \foreach\i in {1,...,\n} \node[red,below] at (A\i) {$\i$}; \end{tikzpicture} \end{document}

enter image description here

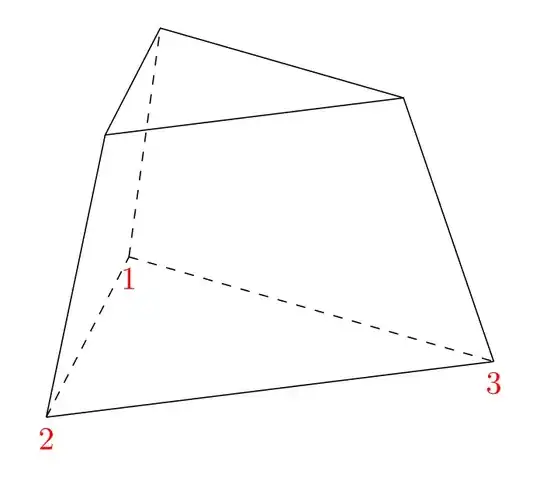
Update 2: Just changing

\pgfmathsetmacro\n{3}  % number of sides
\pgfmathsetmacro\vl{2} % visibility limit

the output will be enter image description here

Juan Castaño
  • 28,426
3

From https://texample.net/media/tikz/examples/TEX/cone.tex modificated.

enter image description here

\documentclass{article}
\usepackage{tikz}
\usepackage[active,tightpage]{preview}
\PreviewEnvironment{tikzpicture}
\setlength\PreviewBorder{5pt} 
\usepackage{tikz-3dplot}
\begin{document}

\tdplotsetmaincoords{70}{0} \begin{tikzpicture}[tdplot_main_coords] \def\RI{2} \def\RII{1.25}

\draw (\RI,0) \foreach \x in {0,300,240,180} { -- (\x:\RI) node at (\x:\RI) (R1-\x) {} }; \draw (R1-0.center) \foreach \x in {60,120,180} { -- (\x:\RI) node at (\x:\RI) (R1-\x) {} }; \path (\RI,0) \foreach \x in {0,60,120,180,240,300} { -- (\x:\RI)}; \begin{scope}[yshift=2cm] \draw (\RII,0) \foreach \x in {0,60,120,180,240,300,360} { -- (\x:\RII) node at (\x:\RII) (R2-\x) {}}; \end{scope}

\foreach \x in {0,180,240,300} { \draw (R1-\x.center)--(R2-\x.center); }; \foreach \x in {60,120} { \draw (R1-\x.center)--(R2-\x.center); }; \end{tikzpicture}

\end{document}

Sebastiano
  • 54,118
3

You can try this code and use \pgfmathtruncatemacro{\Ncorners}{3}. You can change the number 3 by another numbers.

\documentclass[tikz,border=3mm]{standalone}
\usetikzlibrary{calc,3dtools}%
\begin{document}
\begin{tikzpicture}[line cap=round,line join=round]
    \begin{scope}[3d/install view={phi=110,theta=70},
            declare function={R=3.5;R1=2;               H=3;
            },
            dot/.style={circle,fill,inner sep=1.2pt,label=above:{#1}}]
            \pgfmathtruncatemacro{\Ncorners}{3} 
            \path
            (0,0,0) coordinate (O)  
            (0,0,H) coordinate (S)
            (0,0,H/2) coordinate (C)        
            foreach \X in {1,...,\Ncorners}
            {({R*cos(\X*360/\Ncorners)},{R*sin(\X*360/\Ncorners)},0)
                coordinate (A\X)
            }
            foreach \X in {1,...,\Ncorners}
            {({R1*cos(\X*360/\Ncorners)},{R1*sin(\X*360/\Ncorners)},H) coordinate (A'\X)
            };
            \makeatletter
            \edef\myLetter{\@Alph{\Ncorners}}
            \makeatother
        \edef\mycorners{{(A'1)}}        
        \tikzset{add corner/.code={\edef\mycorners{\mycorners,{(A'#1)}}},
            add corner/.list={2,...,\Ncorners}}     
        \begin{scope}[3d/polyhedron/.cd,O={(C)},fore/.append style={fill=none},
            back/.append style={3d/hidden},
            fore/.append style={3d/visible,fill=none},
            edges have complete dashes]
            \foreach \X [remember=\X as \LastX (initially \Ncorners)] in {1,...,\Ncorners}
            {\tikzset{3d/polyhedron/draw face with corners/.expanded={{(A\LastX)},{(A'\LastX)},{(A'\X)},(A\X)}}}
            \tikzset{3d/polyhedron/draw face with corners/.expanded={\mycorners}}
        \end{scope}         
    \end{scope}
\end{tikzpicture}

\end{document}

enter image description here

enter image description here