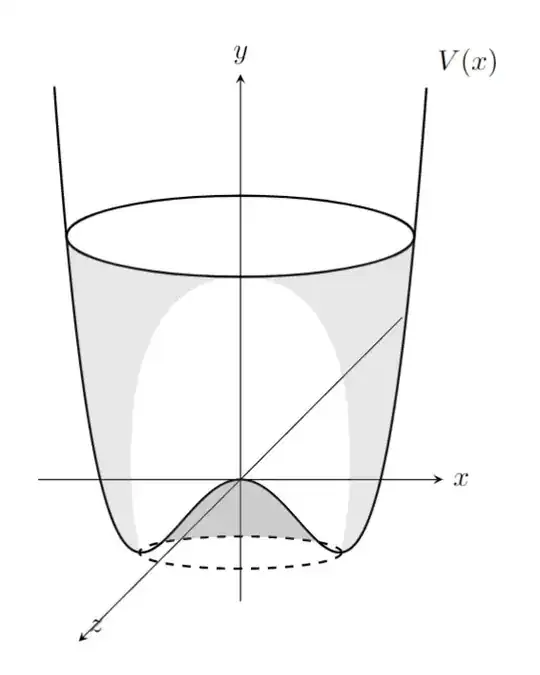
You could make use of the fillbetween library provided via PGFPlots:
\documentclass[border=5mm]{standalone}
\usepackage{tzplot, pgfplots}
\pgfplotsset{compat=1.18}
\usepgfplotslibrary{fillbetween}
\begin{document}
    \begin{tikzpicture}
        \tzaxes(-2.5,-1.5)(2.5,5){$x$}{$y$}
        \tzfn[thick, name path=curve]{(-1.2(\x)^2+0.4(\x)^4)}[-2.3:2.3]{$V(x)$}[ar]
        \tzfn[black, ->]{(\x)}[2:-2]{$z$}[ar]
        \draw[thick, dashed, name path=bottom] (1.25,-0.9)
            arc[start angle=0, end angle=360, x radius=1.25cm, y radius=0.2cm];
        \draw[thick, name path=top] (2.15,3)
            arc[start angle=0, end angle=360, x radius=2.15cm, y radius=0.5cm];
    \path[name path=clipped curve, intersection segments={of=top and curve, sequence={R2}}];
    \fill[gray, opacity=0.2, intersection segments={of=clipped curve and bottom, sequence={L1}}]
        to[out=100, in=180] (0,2.5)
        arc[start angle=270, end angle=180, x radius=2.15cm, y radius=0.5cm] -- cycle;
    \fill[gray, opacity=0.2, intersection segments={of=clipped curve and bottom, sequence={L5[reverse]}}]
        to[out=80, in=0] (0,2.5)
        arc[start angle=270, end angle=360, x radius=2.15cm, y radius=0.5cm];
    \fill[gray, opacity=0.4, intersection segments={of=clipped curve and bottom, sequence={L3 -- R3}}] -- cycle;
\end{tikzpicture}

\end{document}
As proposed in the comments, a variation with patterns to imitate the dotted shadings:
\documentclass[border=5mm]{standalone}
\usepackage{tzplot, pgfplots}
\pgfplotsset{compat=1.18}
\usepgfplotslibrary{fillbetween}
\usetikzlibrary{patterns.meta}
\begin{document}
    \begin{tikzpicture}
        \tzaxes(-2.5,-1.5)(2.5,5){$x$}{$y$}
        \tzfn[thick, name path=curve]{(-1.2(\x)^2+0.4(\x)^4)}[-2.3:2.3]{$V(x)$}[ar]
        \tzfn[black, ->]{(\x)}[2:-2]{$z$}[ar]
        \draw[thick, dashed, name path=bottom] (1.25,-0.9)
            arc[start angle=0, end angle=360, x radius=1.25cm, y radius=0.2cm];
        \draw[thick, name path=top] (2.15,3)
            arc[start angle=0, end angle=360, x radius=2.15cm, y radius=0.5cm];
    \path[name path=clipped curve, intersection segments={of=top and curve, sequence={R2}}];
    \fill[
        pattern={
            Dots[radius=0.4pt, angle=45, distance={2pt/sqrt(2)}]
        },
        intersection segments={
            of={clipped curve and bottom},
            sequence={L1}
        }
    ] to[out=100, in=180] (0,2.5)
        arc[start angle=270, end angle=180, x radius=2.15cm, y radius=0.5cm] -- cycle;
    \fill[
        pattern={
            Dots[radius=0.4pt, angle=45, distance={2pt/sqrt(2)}]
        },
        intersection segments={
            of={clipped curve and bottom},
            sequence={L5[reverse]}
        }
    ] to[out=80, in=0] (0,2.5)
        arc[start angle=270, end angle=360, x radius=2.15cm, y radius=0.5cm];
    \fill[
        pattern={
            Dots[radius=0.7pt, angle=45, distance={2pt/sqrt(2)}]
        },
        intersection segments={
            of={clipped curve and bottom},
            sequence={L3 -- R3}
        }
    ] -- cycle;
\end{tikzpicture}

\end{document}
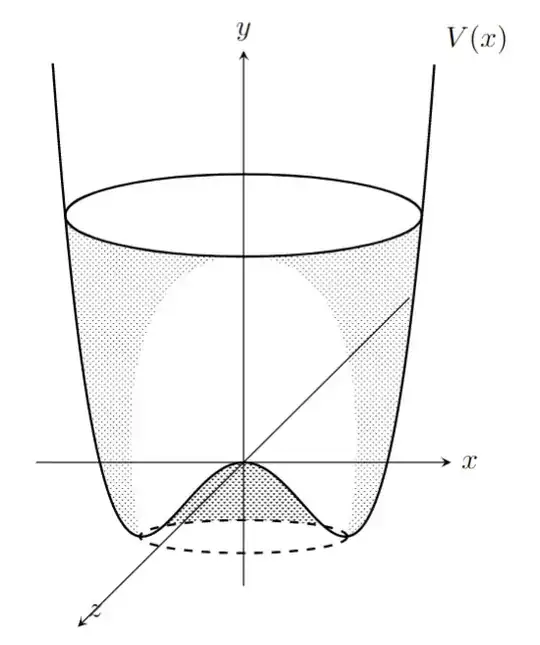

 . I would need help to add the dotted points to give an idea of the shade]
