0

enter image description here

I am currently using MS paint to draw diagrams such as these. However, I would like the loops at the top and at the bottom (line with arrows connecting the blocks) to have rounded corners, as opposed to sharp corners. (More like $\subset$ rather than $\sqsubset$)

Is there a way to do this either in Tikz or some other tool that generates high fidelity diagrams?

This question has been bothering me forever!

3 Answers3

3
\documentclass[10pt,a4paper]{article}

\usepackage{amsmath,tikz}
\usetikzlibrary{positioning}
\begin{document}
    \begin{tikzpicture}
        \node[minimum width=2cm, minimum height=1.5cm, draw] (a) {$\int \cos x \,dx$};
        \node[minimum width=2cm, minimum height=1.5cm, draw, right=2cm of a] (b) {$x^2 \sin x$};
        \draw[-latex, rounded corners] (a) --++(90:2cm)-| node[near start, red, above]{$a$ to $b$} (b);
        \draw[-latex, rounded corners] (b) --++(-90:2cm) -| node[near start, red, below]{$b$ to $a$} (a);
    \end{tikzpicture}   
\end{document}

enter image description here

Ignasi
  • 136,588
2

A variation of @Ignasy answer, but with some (off-topic) image and image code improvements/changes. Differences are marked in code by <---:

\documentclass[margin=3mm]{standalone}
\usepackage{tikz}
\usetikzlibrary{arrows.meta,        % <--- added
                ext.paths.ortho,    % <--- added
                positioning}
\begin{document}
    \begin{tikzpicture}[
arr/.style = {-Latex, rounded corners=4mm},
lbl/.style = {font=\footnotesize, text=red, auto},
  N/.style = {draw, semithick, minimum width=2cm, minimum height=1.5cm}
                        ]           % <--- added image elements styles
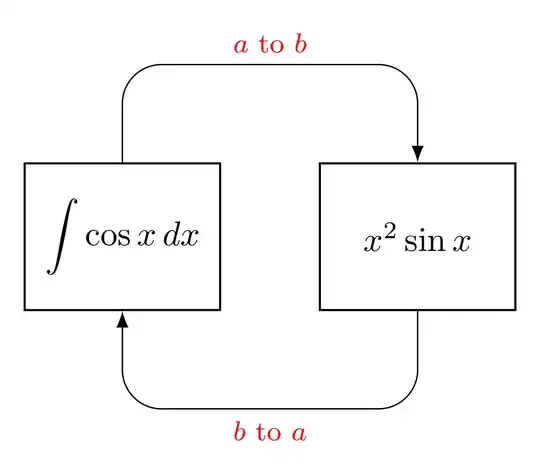
\node[N] (a) {$\displaystyle \int \cos x \,dx$};    % <--- changed
\node[N, right=of a] (b) {$x^2 \sin x$};            % <--- changed

\draw[arr] (a) r-ud [distance=-10mm] node[lbl] {$a$ to $b$} (b); % <--- changed \draw[arr] (b) r-du [distance=-10mm] node[lbl] {$b$ to $a$} (a); % <--- changed \end{tikzpicture} \end{document}

enter image description here

Edit: Now is considered @Qrrbrbirlbel, the TikZ-Extensions package author, comment.

Zarko
  • 296,517
  • \footnotesize needs to be an argument of /utils/exec, font or node font. For this, the udlr paths can be used without having to use the explicit anchor: \draw[arr] (a) r-ud [ud distance=10mm] node[lbl] {$a$ to $b$} (b); \draw[arr] (b) r-du [du distance=10mm] node[lbl] {$a$ to $b$} (a); – Qrrbrbirlbel Jun 22 '23 at 12:56
  • @Qrrbrbirlbel, thank you very much for your comment. Regarding to drawing of arrows, I just miss this possibility in package documentation. Regarding font size for edge labels, now I see that my test file actually for font size has font=\footnotesize. Both are now corrected. – Zarko Jun 22 '23 at 15:15
  • This is very beautiful. Thank you. – Curaçao Hajek Jul 08 '23 at 00:45
1

Like this:

enter image description here

Code:

\documentclass[10pt,a4paper]{article}

\usepackage{amsmath,tikz} \begin{document} \begin{tikzpicture}[scale=2] \draw (0,0) rectangle (.8,.5) node[midway] (a) {$\int \cos x ,dx$}; \draw (2,0) rectangle (2.8,.5) node[midway] (b) {$x^2 \sin x$}; \draw[-latex] (.4,.5) to [out=60,in=120] node[red, above]{$a$ to $b$} (2.4,.5); \draw[-latex] (2.4,0) to [out=-120,in=-60] node[red, below]{$b$ to $a$} (.4,0); \end{tikzpicture}
\end{document}