1

As the name suggests, I am trying tio draw in TikZ the following figure for a surface current distribution (I am used to drawing with hand, so I find the switch to the digital a bit tough):

enter image description here

The striped region is a urface that is covered with current densities J, and the second image is a representation that gives an idea on the relation of all the vectors involved. The dashed line between A and B is an "cross-section" that helps to calculate a line integral with the element being dl, and the vector n is a normal vector to the surface with u a vector orthogonal to it.

Thanks immensly, and have a wonderful day.

  • 4
    Welcome! While your question may be sufficiently interesting to persuade somebody to create two diagrams for you, you should know that there are a lot of people willing to help who are reluctant to answer do-it-for-me questions. If you're finding it tough, that suggests you've tried something you could post. However, if you're used to drawing by hand, I think you might find something like Inkscape easier than TikZ. (You can output code from Inkscape, though it can be rather messy, or output as an image.) – cfr Jul 03 '23 at 00:42
  • You could search for related posts, such as e.g. https://tex.stackexchange.com/q/488865, and try to adapt them. If you run in problems, you will have some code to base your question on. –  Jul 03 '23 at 02:33
  • I tried actually but the syntax seems like a foreign language for me especially that I just began learning that some 4 days ago. However, any input to set me on the path is appreciated. – Stefan Bock Jul 03 '23 at 10:15

1 Answers1

3

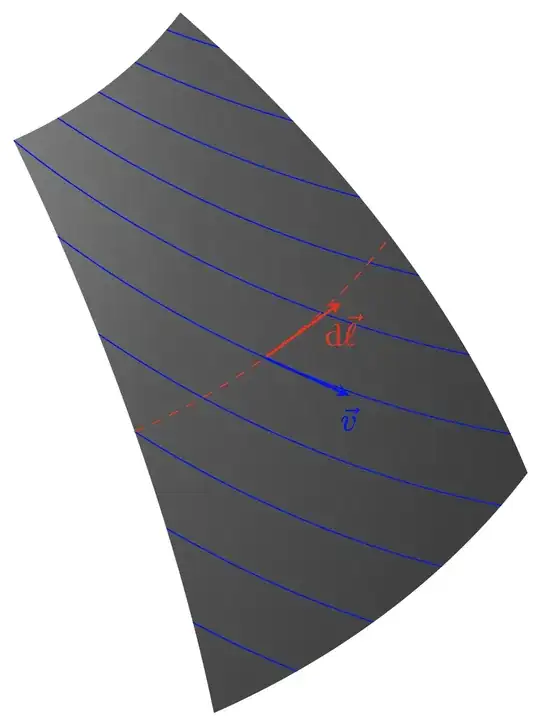
This may be a starting point. You can use 3d coordinates and plot functions in these coordinates. This allows you to show a part of a sphere and to plot various curves in spherical coordinates.

\documentclass[tikz,border=2mm]{standalone}
\usepackage{tikz-3dplot}
\usetikzlibrary{decorations.markings,fpu}
\begin{document}
    \tdplotsetmaincoords{140}{0}
    \begin{tikzpicture}[tdplot_main_coords, 
            line cap=round,line join=round,
            >=stealth,
            smooth,variable=\t,
            declare function={R=10;% radius
            phimin=30;phimax=60;% longitude range
            thetamin=20;thetamax=60;% latitude range
            }]
        \begin{scope}
            \clip plot[domain=phimin:phimax] (xyz spherical cs:radius=R,latitude=thetamin,longitude=\t)
            -- plot[domain=thetamin:thetamax] (xyz spherical cs:radius=R,latitude=\t,longitude=phimax)
            -- plot[domain=phimax:phimin] (xyz spherical cs:radius=R,latitude=thetamax,longitude=\t)
            -- plot[domain=thetamax:thetamin] (xyz spherical cs:radius=R,latitude=\t,longitude=phimin)
            -- cycle;
            \path[tdplot_screen_coords,ball color=gray] circle[radius=R];
            \foreach \X in {1,...,10}
            {\pgfmathsetmacro{\mythetamin}{thetamin+phimin+\X*(thetamax-thetamin)/6}
            \ifnum\X=5\relax 
                \draw[/pgf/fpu/install only={reciprocal},blue,postaction={decorate,decoration={markings,
                mark=at position 0.485 with {\draw[blue,->,solid,thick] (0pt,0pt) -- (1cm,0pt) node[below]{$\vec v$};}}}] plot[domain=phimin:phimax] (xyz spherical cs:radius=R,latitude=\mythetamin-\t,longitude=\t);
            \else
                \draw[blue] plot[domain=phimin:phimax] (xyz spherical cs:radius=R,latitude=\mythetamin-\t,longitude=\t);
            \fi    
            }
        \end{scope}
        \draw[/pgf/fpu/install only={reciprocal},
            red,dashed,postaction={decorate,decoration={markings,
            mark=at position 0.47 with {\draw[red,->,solid,thick] (0pt,0pt) -- (1cm,0pt) node[below]{$\mathrm{d}\vec\ell$};}}}] plot[domain=phimin:phimax] (xyz spherical cs:radius=R,latitude={0.5*thetamin+0.5*thetamax},longitude={\t});
    \end{tikzpicture}
\end{document}

enter image description here

Yes, it is an effort to learn the LaTeX syntax, but if you want to be able to independently produce such figures, you can either wait till AI can produce clean codes or learn to do it yourself.

  • Ah and by the way, one of the reasons I am not advancing is due to the time constraint. I am even willing to pay someone who can help me draw those figures so that I can focus on the content I am redacting. – Stefan Bock Jul 04 '23 at 22:00