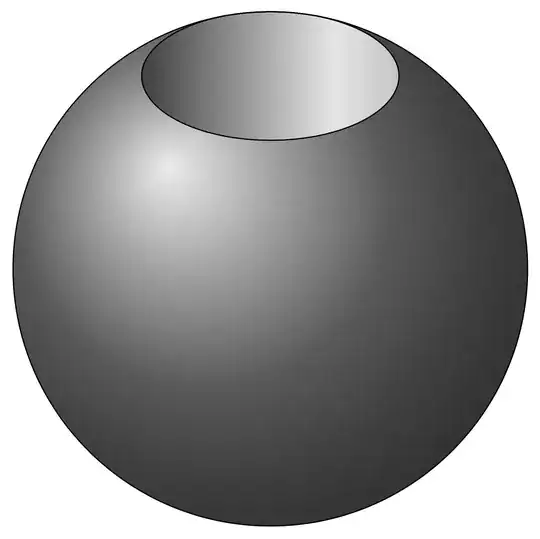
As I tried to explain in my comment, the parameters used in the answer you link to are tuned in such a way that, in screen coordinates, the top-most point of the circle coincides with the top-most point of the sphere. More specifically, the answer dials the ratio of cylinder and sphere radii in such a way that these points coincide in the isometric view. The following tunes the view angle in such a way that these points coincide for a given cylinder radius r and sphere radius R. This allows you to have the x-axis point in any direction you want.
\documentclass[tikz,border=2mm]{standalone}
\usepackage{tikz-3dplot}
\begin{document}
\begin{tikzpicture}[declare function={R=3;% radius of sphere
        r=1.5;% radius of cylinder
    }]
    \pgfmathsetmacro{\myalpha}{asin(r/R)}
    \pgfmathsetmacro{\myh}{R*cos(\myalpha)}
    \tdplotsetmaincoords{90-\myalpha}{0}
    \begin{scope}[tdplot_main_coords]
      \begin{scope}
        \clip (0,0,\myh) circle[radius=r];
        \path[left color=gray!50!black,right color=gray,middle color=gray!20] (r/2,0,\myh) circle[radius=1.5*r];;
      \end{scope}
      \draw[ball color=gray,even odd rule]  (0,0,\myh) circle[radius=r]
        [tdplot_screen_coords] (0,0) circle[radius=R];
    \end{scope}
\end{tikzpicture}
\end{document}
However, it is clear that this is not the most general situation, in which you can choose the radii and view angles independently of each other. This is what the following code does.
\documentclass[tikz,border=2mm]{standalone}
\usepackage{tikz-3dplot}
\begin{document}
\begin{tikzpicture}[declare function={R=3;% radius of sphere
        r=1.5;% radius of cylinder
        theta=75;% view angle
    }]
    \pgfmathsetmacro{\myalpha}{asin(r/R)}
    \pgfmathsetmacro{\myh}{R*cos(\myalpha)}
    \pgfmathtruncatemacro{\iflag}{ifthenelse(theta>90-\myalpha,1,0)}
    \ifnum\iflag=0\relax
        \path[ball color=gray] (0,0) circle[radius=R];
    \else
        \pgfmathsetmacro{\myhprime}{\myh*sin(theta)+r*cos(theta)}
        \pgfmathsetmacro{\mytcrit}{-asin((r*cos(theta)*\myhprime)/(r*r-\myhprime*\myhprime))}
        \pgfmathsetmacro{\mybeta}{90-atan2(\myhprime+r*cos(theta)*sin(\mytcrit),r*cos(\mytcrit))}
        \pgfmathsetmacro{\mytcrit}{\mytcrit/cos(theta)}
        \path[ball color=gray]  (90-\mybeta:R) arc[start angle=90-\mybeta,end angle=-270+\mybeta,radius=R];
    \fi
    \tdplotsetmaincoords{theta}{0}
    \begin{scope}[tdplot_main_coords]
        \draw[dashed] (0,0,-\myh) circle[radius=r] (-r,0,\myh) edge (-r,0,-\myh) (r,0,\myh) edge (r,0,-\myh);
        \clip (0,0,\myh) circle[radius=r];
        \path[left color=gray!50!black,right color=gray,middle color=gray!20] (r/2,0,\myh) circle[radius=1.5*r];
        \fill (0,0,-\myh) circle[radius=r];
    \end{scope}
\end{tikzpicture}
\end{document}
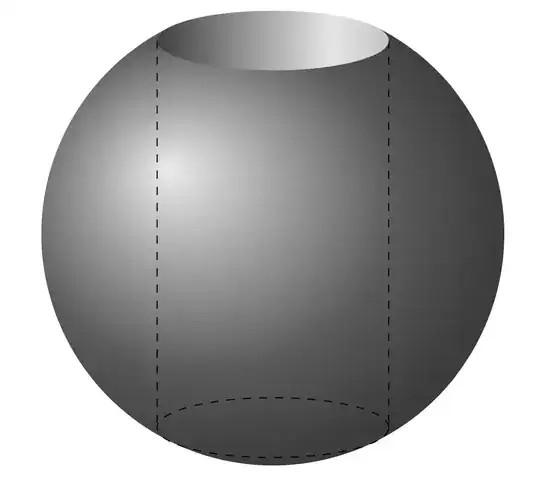
You can set the view angle theta to change the view. The other view angle is redundant because of the rotational symmetry about the z-axis. This version also truncates the sphere at the bottom.
\documentclass{article}
\usepackage[margin=1cm]{geometry}
\usepackage{tikz}
\usepackage{tikz-3dplot}
\newcommand{\DrawSphereInCylinder}[1]{\begin{tikzpicture}[declare function={R=3;% radius of sphere
r=1.5;% radius of cylinder
theta=#1;% view angle
}]
\pgfmathsetmacro{\myalpha}{asin(r/R)}
\pgfmathsetmacro{\myh}{R*cos(\myalpha)}
\pgfmathtruncatemacro{\iflag}{ifthenelse(theta>90-\myalpha,1,0)}
\tdplotsetmaincoords{theta}{0}
\ifnum\iflag=0\relax
\path[ball color=gray] (0,0) circle[radius=R];
\else
\pgfmathsetmacro{\myhprime}{\myh*sin(theta)+r*cos(theta)}
\pgfmathsetmacro{\mytcrit}{-asin((r*cos(theta)*\myhprime)/(r*r-\myhprime*\myhprime))}
\pgfmathsetmacro{\mybeta}{90-atan2(\myhprime+r*cos(theta)*sin(\mytcrit),r*cos(\mytcrit))}
\pgfmathsetmacro{\mytcrit}{asin((cos(theta)*\myhprime)/(r*sin(theta)*sin(theta)))}
\path[ball color=gray] (90-\mybeta:R) arc[start angle=90-\mybeta,end angle=-90+\mybeta,radius=R]
[tdplot_main_coords]
-- ({r*cos(-\mytcrit)},{-r*sin(\mytcrit)},-\myh)
arc[start angle=-\mytcrit,end angle=-180+\mytcrit,radius=r]
[tdplot_screen_coords]
-- (-90-\mybeta:R) arc[start angle=-90-\mybeta,end angle=-270+\mybeta,radius=R];
\fi
\begin{scope}[tdplot_main_coords]
\ifnum\iflag=0\relax
\draw[dashed] (0,0,-\myh) circle[radius=r] (-r,0,\myh) edge (-r,0,-\myh) (r,0,\myh) edge (r,0,-\myh);
\else
\draw[dashed] ({r*cos(-\mytcrit)},{-r*sin(\mytcrit)},-\myh)
arc[start angle=-\mytcrit,end angle=180+\mytcrit,radius=r]
(-r,0,\myh) edge (-r,0,-\myh) (r,0,\myh) edge (r,0,-\myh);
\fi
\clip (0,0,\myh) circle[radius=r];
\path[left color=gray!50!black,right color=gray,middle color=gray!20] (r/2,0,\myh) circle[radius=1.5*r];
\fill[white] (0,0,-\myh) circle[radius=r];
\end{scope}
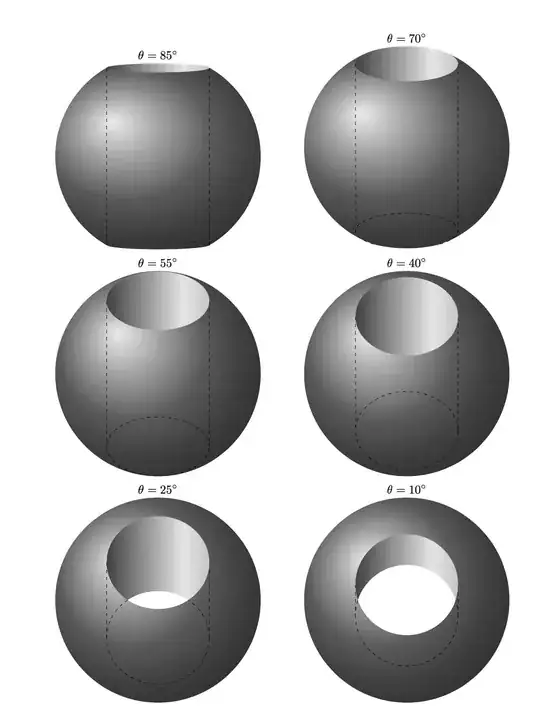
\path (current bounding box.north) node[above]{$\theta={#1}^\circ$};
\end{tikzpicture}}
\begin{document}
\begin{tabular}{cc}
\DrawSphereInCylinder{85} & \DrawSphereInCylinder{70}\\
\DrawSphereInCylinder{55} & \DrawSphereInCylinder{40}\\
\DrawSphereInCylinder{25} & \DrawSphereInCylinder{10}\\
\end{tabular}
\end{document}


asymptotewould be a better choice here. – projetmbc Jul 04 '23 at 18:58