Inspired by the answers to this question, you could try with gnuplot:
\documentclass[border=10pt]{standalone}
\usepackage{amsmath}
\usepackage{pgfplots}
\pgfplotsset{compat=newest}
\begin{document}
    \begin{tikzpicture}
        \begin{axis}[
            align = center,
            title = {
                \textbf{Six-hump camel back function} \
                $\scriptsize f(x,y) =
                    \left(4 - 2.1 x_1^2 + \frac{x_1^4}{3}\right) x_1^2 + x_1
                    x_2 + \left(-4 + 4 x_2^2\right) x_2^2$
                },
            view = {310}{30},
            xtick = {2,1,...,-2},
            ytick = {1,0.5,...,-1},
            ztick = {6,5,...,-2},
            xmin = -2, xmax = 2,
            ymin = -1, ymax = 1,
            zmin = -2, zmax = 6,
            ticklabel style = {
                font = \scriptsize
            },
            grid = major,
            xlabel = $x$,
            ylabel = $y$,
            zlabel = $z$

        ]
    \addplot3[
        mark=*,
        red,
        draw = none,
        point meta = explicit symbolic,
        nodes near coords
    ] coordinates {
        (0,0.75,-2) [{\scriptsize A minimum}]
        (0,-0.75,-2) [{\scriptsize A minimum}]
    };

    \addplot3+[
        no markers,
        raw gnuplot,
        z filter/.code={\def\pgfmathresult{-2}},
    ] gnuplot {
        unset surface;
        set contour base;
        set cntrparam levels 20;
        set isosamples 200;
        set samples 51;
        splot [-2:2][-1:1][-2:6]
            (4 - 2.1*x^2 + x^4/3)*x^2 + x*y + (-4 + 4*y^2)*y^2;
    };

    \addplot3[
        surf,
        colormap/jet,
        shader = faceted,
        fill opacity = 0.75,
        samples = 51,
        domain = -2:2,
        y domain = -1:1
    ] {(4 - 2.1*x^2 + x^4/3)*x^2 + x*y + (-4 + 4*y^2)*y^2};

    \end{axis}

\end{tikzpicture}
\end{document}
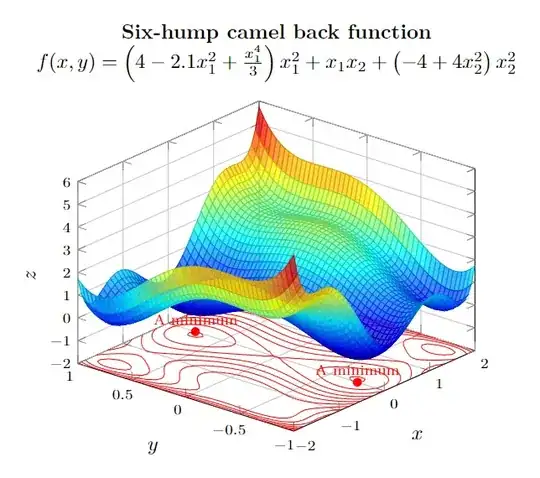
Coloring can be done via contour prepared:
\documentclass[border=10pt]{standalone}
\usepackage{amsmath}
\usepackage{pgfplots}
\pgfplotsset{compat=newest}
\begin{document}
    \begin{tikzpicture}
        \begin{axis}[
            align = center,
            title = {
                \textbf{Six-hump camel back function} \
                $\scriptsize f(x,y) =
                    \left(4 - 2.1 x_1^2 + \frac{x_1^4}{3}\right) x_1^2 + x_1
                    x_2 + \left(-4 + 4 x_2^2\right) x_2^2$
                },
            view = {310}{30},
            xtick = {2,1,...,-2},
            ytick = {1,0.5,...,-1},
            ztick = {6,5,...,-2},
            xmin = -2, xmax = 2,
            ymin = -1, ymax = 1,
            zmin = -2, zmax = 6,
            ticklabel style = {
                font = \scriptsize
            },
            grid = major,
            xlabel = $x$,
            ylabel = $y$,
            zlabel = $z$

        ]
    \addplot3[
        mark=*,
        red,
        draw = none,
        point meta = explicit symbolic,
        nodes near coords
    ] coordinates {
        (0,0.75,-2) [{\scriptsize A minimum}]
        (0,-0.75,-2) [{\scriptsize A minimum}]
    };

    \addplot3+[
        contour prepared,
        contour/labels = false,
        colormap/jet,
        point meta = rawz,
        no markers,
        raw gnuplot,
        z filter/.code={\def\pgfmathresult{-2}},
    ] gnuplot {
        unset surface;
        set contour base;
        set cntrparam levels 20;
        set isosamples 200;
        splot [-2:2][-1:1][-2:6]
            (4 - 2.1*x^2 + x^4/3)*x^2 + x*y + (-4 + 4*y^2)*y^2;
    };

    \addplot3[
        surf,
        colormap/jet,
        shader = faceted,
        fill opacity = 0.75,
        samples = 51,
        domain = -2:2,
        y domain = -1:1
    ] {(4 - 2.1*x^2 + x^4/3)*x^2 + x*y + (-4 + 4*y^2)*y^2};

    \end{axis}

\end{tikzpicture}
\end{document}

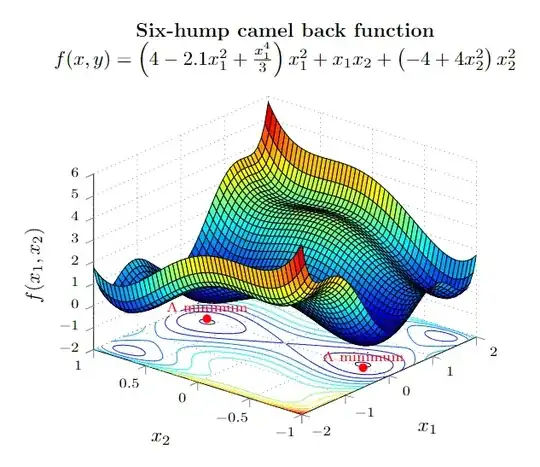
With a few additional options, you'll get quite close to the original:
\documentclass[border=10pt]{standalone}
\usepackage{amsmath}
\usepackage{pgfplots}
\pgfplotsset{compat=newest}
\begin{document}
    \begin{tikzpicture}
        \begin{axis}[
            align = center,
            title = {
                \textbf{Six-hump camel back function} \
                $\scriptsize f(x,y) =
                    \left(4 - 2.1 x_1^2 + \frac{x_1^4}{3}\right) x_1^2 + x_1
                    x_2 + \left(-4 + 4 x_2^2\right) x_2^2$
                },
            view = {310}{30},
            xtick = {2,1,...,-2},
            ytick = {1,0.5,...,-1},
            ztick = {6,5,...,-2},
            xmin = -2, xmax = 2,
            ymin = -1, ymax = 1,
            zmin = -2, zmax = 6,
            ticklabel style = {
                font = \scriptsize
            },
            grid = major,
            xlabel = {$x_1$},
            ylabel = {$x_2$},
            zlabel = {$f(x_1,x_2)$},
            axis lines*=left,
            tick align=outside,
            major grid style={
                dotted, gray
            }
        ]
    \addplot3[
        mark=*,
        red,
        draw = none,
        point meta = explicit symbolic,
        nodes near coords
    ] coordinates {
        (0,0.75,-2) [{\scriptsize A minimum}]
        (0,-0.75,-2) [{\scriptsize A minimum}]
    };

    \addplot3+[
        contour prepared,
        contour/labels = false,
        colormap/jet,
        point meta = rawz,
        no markers,
        raw gnuplot,
        z filter/.code={\def\pgfmathresult{-2}},
    ] gnuplot {
        unset surface;
        set contour base;
        set cntrparam levels 20;
        set isosamples 200;
        splot [-2:2][-1:1][-2:6]
            (4 - 2.1*x^2 + x^4/3)*x^2 + x*y + (-4 + 4*y^2)*y^2;
    };

    \addplot3[
        surf,
        colormap/jet,
        shader = flat,
        draw = black,
        samples = 51,
        domain = -2:2,
        y domain = -1:1
    ] {(4 - 2.1*x^2 + x^4/3)*x^2 + x*y + (-4 + 4*y^2)*y^2};

    \end{axis}

\end{tikzpicture}
\end{document}