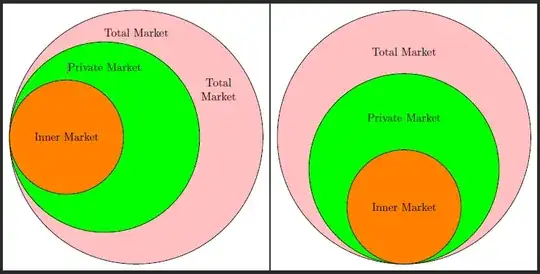
Here are two more alternatives for you:
- left: putting two (or three) more nodes as labels
- right: same idea, but anchored south (i.e. using same amount of space)
Did some refactoring wrt styles, also to simplify code lines:
 \begin{tikzpicture}[
    crc/.style={circle,anchor=west,draw},
    lbl/.style={align=center},
    ]
    % ~~~ cicles ~~~~~~~~~~~~~~~~~~~~~
    \node[crc, minimum size=8cm, fill=pink]     (a) {};
...
To place the labels, just shift them wrt to the colored nodes, either using cartesian or polar notation:
    % ... two alternatives ...........
    \node[yshift=33mm]  at (a)                  {Total Market};
    \node[lbl]          at ([shift=(30:3.0)] a) {Total\\Market};
Code:
\documentclass[tikz,border=2mm]{standalone}
\begin{document}
 \begin{tikzpicture}[
    crc/.style={circle,anchor=west,draw},
    lbl/.style={align=center},
    ]
    % ~~~ cicles ~~~~~~~~~~~~~~~~~~~~~
    \node[crc, minimum size=8cm, fill=pink]     (a) {};
    \node[crc, minimum size=6cm, fill=green,]   (b) {};
    \node[crc, minimum size=3.6cm, fill=orange] (c) {Inner Market};
    % ~~~ labels ~~~~~~~~~~~~~~~
    \node[yshift=22mm]  at (b)                  {Private Market};
    % ... two alternatives ...........
    \node[yshift=33mm]  at (a)                  {Total Market};
    \node[lbl]          at ([shift=(30:3.0)] a) {Total\Market};
 \end{tikzpicture}
\begin{tikzpicture}[
    crc/.style={circle,anchor=south,draw},
    %lbl/.style={align=center},
    ]
    % ~~~ cicles ~~~~~~~~~~~~~~~~~~~~~
    \node[crc, minimum size=8cm, fill=pink]     (a) {};
    \node[crc, minimum size=6cm, fill=green,]   (b) {};
    \node[crc, minimum size=3.6cm, fill=orange] (c) {Inner Market};
    % ~~~ labels ~~~~~~~~~~~~~~~
    \node[yshift=16mm]  at (b)                  {Private Market};
    \node[yshift=27mm]  at (a)                  {Total Market};
 \end{tikzpicture}
\end{document}


(-90:<radius>) arc[start angle=-90, delta angle=180, radius=<radius>]. – Qrrbrbirlbel Nov 13 '23 at 20:57text along pathdecoration itself. – Qrrbrbirlbel Nov 14 '23 at 00:22