Here's a way to do it. This approach still needs manual adjustment when your formulas vary too much in content. However, I suggest adopting this approach for several reasons.
standalone is much nicer to use during development: it adjusts "papersize" as needed- instead of including
Tikz code in your main document, you could display the compiled Tikz diagram (pdf) in your main via package graphicx, which still will be vector format (no bitmap artefacts)
- place nodes as you need; chose styles as needed, put them in the beginning
- the reference edge of node
(C) will be west, i.e. that's where (.7,0) will be (or vice versa)
- the correct tip positions do depend both on the vertical distance of the formulas AND the
inner sep of the left formula nodes
- to visualize that style
lf draws the nodes shape; set to draw=none later
- to position the arrow tips I used polar notation:
- from the nodes center, with 0deg being to the right, where do rays intersect the nodes shape? That's the (estimated) angle you want
So for major design changes with this approach:
- change all
.7 values to whatever you need
- adjust the polar angles
.215, .30, .145 and .-30
For a more sophisticated (more automized) approch see the solution you accepted with tikzmarks and overlay. Without having tested that, the arrow tips may or may not point to the 4 factors center
\documentclass[10pt,border=3mm,tikz]{standalone}
\begin{document}
\begin{tikzpicture}[
rf/.style={anchor=west},
lf/.style={inner sep=1pt,draw=gray!70},% later remove draw or seet draw=none
]
% ~~~ nodes with formulas ~~~~~~~~~~~~
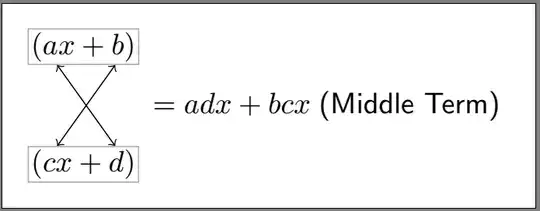
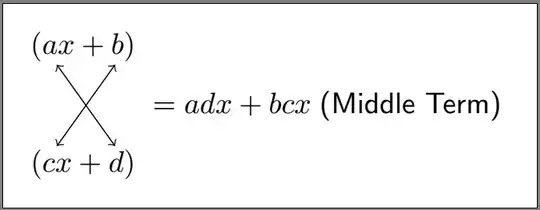
\node[lf] (A) at ( 0, .7) {$(ax+b)$};
\node[lf] (B) at ( 0,-.7) {$(cx+d)$};
\node[rf] (C) at (.7,0) {$=adx+bcx;$\textsf{(Middle Term)}};
% ~~~ crossing ~~~~~~~~~~~~~
\draw[<->] (A.215) -- (B.30);
\draw[<->] (B.145) -- (A.-30);
\end{tikzpicture}
\end{document}
WITH nodes shape drawn:
NONE:
P.S.
Here are some things you can do wrt your comment.
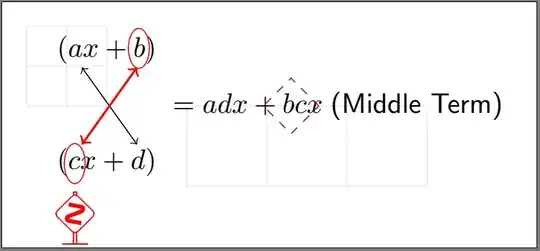
Highlighting an arrow
Easy as can be:
\draw[<->,red,thick] (B.145) -- (A.-30); % <<<
Make up your mind, whether or not letting those options be local (as shown) or moved to the style section at the beginning (like rf etc.). Criteria can be, e.g., code clean-up, generalization, reuse, space, etc.
Temporary help grids
Often it's good to have a better idea about the coordinates you want. Besides experience and good guessing help grids can be a life saver:
    % ~~~ help grids: delete later or comment out ~~~~~~~~~~
    \draw[blue!10,step=5mm] (0,0) grid (-1,1);
    \draw[blue!10         ] (1,0) grid (4,-1);
Ellipse from Tikz standards
You just draw them, i.e.:
- start the path by
\, end it by ;
- do some action in between (like in a movie scene)
draw, red, at said position- put an ellipse there
- use style
ell
...
    ell/.style={x radius=1.3mm,y radius=2.5mm}, % <<<
...
\draw[red]  ( .4, .72) ellipse [ell];
If you want even more action on a path put a node at the last position, like so:
\draw[red] (-.4,-.72) ellipse [ell] node[yshift=-5mm]{\dbend};
which happens to be one of Knuth's warning signs, shifted below. It's regular Latex text, inside a nodes {braces}. You find both the font symbol and the required package in The Comprehensive LaTeX Symbol List.
Using the shape library
It's described in the pgfmanual.
Remember, nodes have a shape, which happens to be rectangular by default, while this library lets you change said (outer) shape. For demonstration puproses I used a diamond.
Remember, that those "symbols" still are nodes. So to change their size, use node statements, like minimum width, minimum size etc. BUT no radii etc.
And yes, you can add more to a self-defined style locally, like dashed.
...
    dmn/.style={shape=diamond,,minimum size=7mm,draw,purple},
...
    \node[dmn,dashed] at (2.3,0) {};
Enhanced code
\documentclass[10pt,border=3mm,tikz]{standalone}
\usetikzlibrary{shapes.geometric} % <<<
\usepackage{manfnt} % <<< Knuth's warning sign
\begin{document}
\begin{tikzpicture}[
rf/.style={anchor=west},
lf/.style={inner sep=1pt}, % <<<
% ~~~ standard Tikz ~~~~~~~~~~~~
ell/.style={x radius=1.3mm,y radius=2.5mm}, % <<<
% ~~~ using tikzlibrary ~~~~~~~~~~~~~~~~~~~~~~~~~~~~~~
dmn/.style={shape=diamond,,minimum size=7mm,draw,purple},
]
% ~~~ help grids: delete later or comment out ~~~~~~~~~~
\draw[blue!10,step=5mm] (0,0) grid (-1,1);
\draw[blue!10 ] (1,0) grid (4,-1);
% ~~~ nodes with formulas ~~~~~~~~~~~~
\node[lf] (A) at ( 0, .7) {$(ax+b)$};
\node[lf] (B) at ( 0,-.7) {$(cx+d)$};
\node[rf] (C) at (.7,0) {$=adx+bcx\;$\textsf{(Middle Term)}};
% ~~~ crossing ~~~~~~~~~~~~~
\draw[<->] (A.215) -- (B. 30);
\draw[<->,red,thick] (B.145) -- (A.-30); % <<<
% ~~~ some symbols ~~~~~~~~~~~~~~~~~~ % <<<
\draw[red] ( .4, .72) ellipse [ell];
\draw[red] (-.4,-.72) ellipse [ell] node[yshift=-5mm]{\dbend};
\node[dmn,dashed] at (2.3,0) {};
\end{tikzpicture}
\end{document}


