{mindmaps} are graphical representations of concepts or ideas, together with other related concepts and annotations. {tikz-pgf} provides a mindmap library for drawing {mindmaps}.
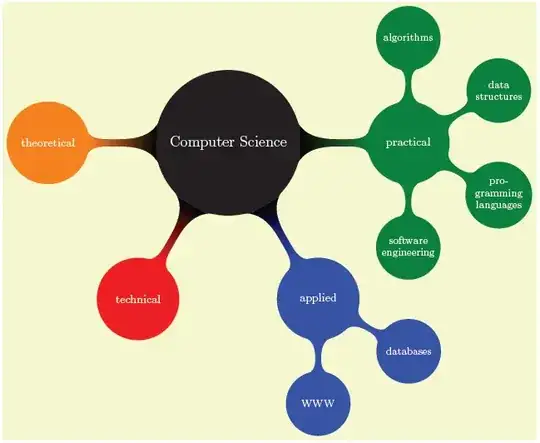
A mindmap is a graphical representation of a concept together with related concepts and annotations. Mindmaps are, essentially, trees, possibly with a few extra edges added, but they are usually drawn in a special way: The root concept is placed in the middle of the page and is drawn as a huge circle, ellipse, or cloud. The related concepts then "leave" this root concept via branch-like tendrils.
\begin{tikzpicture}
  \path[mindmap,concept color=black,text=white]
    node[concept] {Computer Science}
    [clockwise from=0]
    % note that `sibling angle' can only be defined in
    % `level 1 concept/.append style={}'
    child[concept color=green!50!black] {
      node[concept] {practical}
      [clockwise from=90]
      child { node[concept] {algorithms} }
      child { node[concept] {data structures} }
      child { node[concept] {pro\-gramming languages} }
      child { node[concept] {software engineer\-ing} }
    }
    child[concept color=blue] {
      node[concept] {applied}
      [clockwise from=-30]
      child { node[concept] {databases} }
      child { node[concept] {WWW} }
    }
    child[concept color=red] { node[concept] {technical} }
    child[concept color=orange] { node[concept] {theoretical} };
\end{tikzpicture}
The above was description was taken from the tikz/pgf package documentation.