You can transform many functions into piecewise Bezier approximations by using the derivative to calculate the inner control points (which represent tangent vectors for the curve at the end-points).
A very good write-up is Bill Casselmann's Mathematical Illustrations, ch. 6 Curves and ch. 7 Drawing Curves Automatically, which I will be re-reading before saying more. But, effectively, any system which implements Bezier curves can be used to approximate other functions by sampling and interpolation.
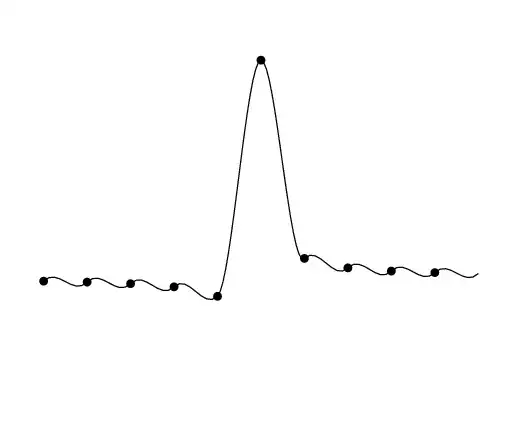
Here's a postscript illustration. It's sometimes necessary to invent an interpretation of x/0 to allow the calculation to procede using /div{dup 0 eq{pop pop 100000}{div}ifelse}bind def. Edit: modified to show endpoints of each curve.
N=10:
N=100:

%!

/circ { % draw a circle at current point, radius: 3*linewidth
    gsave
        currentpoint newpath % cx cy
        currentlinewidth 3 mul % cx cy r
        0 360 % cx cy r ang^ ang$
        arc fill %draw and fill the circle
    grestore
} def

% x0 x1 N  sin1x  -
% approximate sin(1/x) in N segments with piecewise Bezier curves
% N: number of segments,
% x0,x1: endpoints (x- ordinates)
%
/sin1x { 16 dict begin
    {N x1 x0}{exch def}forall   %give names to the arguments
    /f { 1 exch div sin } def   %f(x) = sin(1/x)
    /f' { 1 exch div cos } def  %f'(x) = cos(1/x)
    /h x1 x0 sub N div def      %dx
    /x x0 def                   %x = x0
    /y x f def                  %y = f(x)
    /s x f' def                 %s = f'(x)
    x y moveto               %place initial point at x0,f(x0)
    N {                         %repeat N times ...
        circ                    %draw circle to show endpoint
        x h 3 div add
        y h 3 div s mul add  % x+(dx/3) y+(dx/3)*s           ctrl pt 1
        /x x h add def          %x = x + dx
        /y x f def              %y = f(x)
        /s x f' def             %s = f'(x)
        x h 3 div sub
        y h 3 div s mul sub  % x+dx-(dx/3) f(x+dx)-(dx/3)*s  ctrl pt 2
        x y                  % x+dx f(x+dx)                  end pt
        curveto                 %draw curve segment, end pt becomes start of next seg
    } repeat
} def

% translate origin to roughly the center of US letter paper
300 400 translate

% scale by 200, but reduce linewidth by same proportion
% ie. scale the *drawing*, not the *image*
1 200 dup dup scale
div currentlinewidth mul setlinewidth

%x0 x1 N
-1 1 100 sin1x stroke
showpage
x^2can be represented exactly by a cubic polynomial without interpolation errors. – Christian Feuersänger Mar 03 '13 at 16:04sin(1/x)is certainly possible to draw sufficiently realistic. Otherwise you need to use a CAS which TeX is certainly not. Try this\begin{tikzpicture}\begin{axis}\addplot[domain=-0.01:0.01,samples=6000] {sin(1/x)};\end{axis}\end{tikzpicture}. The sensitivity can be increased if you use gnuplot as the backend. – percusse Mar 03 '13 at 17:02