This relates to an earlier question I got an answer to the first part and followed some links for the second and came up with a mishmash of code to get it doing what I want but I didn't understand much of what is in the examples with for-loops so they are not the best starting point for me.
Here is a small example of the circle code
\documentclass[paper=a4, fontsize=12pt]{scrartcl}
\usepackage{amsmath,amsfonts,amsthm}
\usepackage{graphicx}
\usepackage{float}
\setlength\parindent{0pt}
\usepackage{tikz}
\usetikzlibrary{arrows,%
plotmarks}
\begin{document}
\begin{figure}[H]
\makeatletter
\tikzset{
dot diameter/.store in=\dot@diameter,
dot diameter=3pt,
dot spacing/.store in=\dot@spacing,
dot spacing=10pt,
dots/.style={
line width=\dot@diameter,
line cap=round,
dash pattern=on 0pt off \dot@spacing
}
}
\makeatother
\centering
\label{fig:circle}
\begin{tikzpicture}
% Axis
\draw[thick,->,black] (-4,0)--(4,0) node[below] {$n_x$};
\draw[thick,->,black] (0,-4)--(0,4) node[left] {$n_y$};
\draw[black,thick] (0,0) circle (3.5cm);
%dots
\draw [black, dot diameter=4pt, dot spacing=10pt, dots] (0pt,3.5) -- (0pt,6pt) ;
\draw [black, dot diameter=4pt, dot spacing=10pt, dots] (0pt,0) -- (110pt,0) ;
\draw [black, dot diameter=4pt, dot spacing=10pt, dots] (10pt,3.5) -- (10pt,6pt) ;
\draw [black, dot diameter=4pt, dot spacing=10pt, dots] (20pt,3.5) -- (20pt,6pt) ;
\draw [black, dot diameter=4pt, dot spacing=10pt, dots] (30pt,3.5) -- (30pt,6pt) ;
\draw [black, dot diameter=4pt, dot spacing=10pt, dots] (40pt,3.5) -- (40pt,6pt);
\draw [black, dot diameter=4pt, dot spacing=10pt, dots] (50pt,3.5) -- (50pt,6pt) ;
\draw [black, dot diameter=4pt, dot spacing=10pt, dots] (60pt,3.5) -- (60pt,6pt) ;
\draw [black, dot diameter=4pt, dot spacing=10pt, dots] (70pt,3.5) -- (70pt,6pt) ;
\draw [black, dot diameter=4pt, dot spacing=10pt, dots] (80pt,3.5) -- (80pt,6pt) ;
\draw [black, dot diameter=4pt, dot spacing=10pt, dots] (90pt,3.5) -- (90pt,6pt) ;
\draw [black, dot diameter=4pt, dot spacing=10pt, dots] (100pt,3.5) -- (100pt,6pt) ;
\end{tikzpicture}
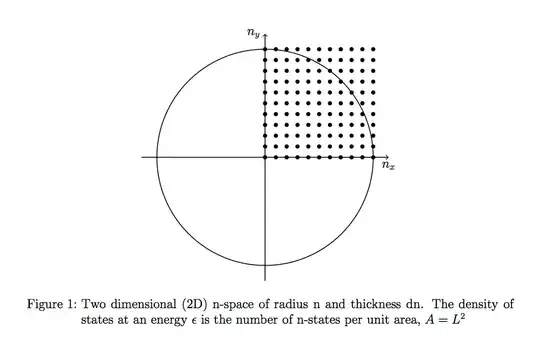
\caption{Two dimensional (2D) n-space of radius n and thickness dn. The density of states at an energy $\epsilon$ is the number of n-states per unit area, $A=L^2$}
\end{figure}
\end{document}


foreachandstyle. – kiss my armpit Mar 08 '13 at 20:28texdoc pgfto bring the pgf documentation up and read page 35 (aboutforeach) and 28 (aboutstyle). – kiss my armpit Mar 08 '13 at 20:31