When plotting a \pgfmathdeclarefunctioned function the graph gets an offset to the right that is proportional to the number of times the function is called in the formula.
I have boiled my initial code down to following example, which exhibits the behaviour:
\documentclass[12pt]{scrbook}
\usepackage{tikz,pgfplots}
\begin{document}
\pgfmathdeclarefunction{f}{1}{ \pgfmathparse{#1 * #1} }
\begin{figure}
\centering
\begin{tikzpicture}
\begin{axis}
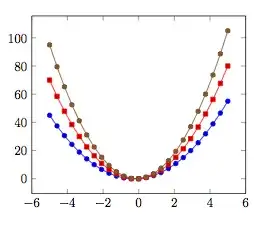
\addplot {x + 2 * x * x}; %no shift (clearly centered
%\addplot {x + 2 * f(x)}; %little shift to the right
%\addplot {x + f(x) + f(x)}; %shifted nearly off the sheet
\end{axis}
\end{tikzpicture}
\end{figure}
\end{document}
In this example it is obviously easy to write the function inside the \addplot command. But I have a more complex function which is used all over the place and shifts my plots off the page.
I am pretty new to LaTex and probably did an error somewhere, but I can't find it. So what is wrong with this?
\pgfmathdeclarefunction{f}{1}{\pgfmathparse{#1*#1}}instead. – jub0bs Mar 26 '13 at 17:18