I have four simple databases:
db1
dy,volume
2009,120000
2010,160000
2011,400000
2012,650000
2013,1000000
2014,1500000
db2
dy,volume
2009,400000
2010,500000
2011,1600000
2012,2200000
2013,2500000
2014,4000000
db3
dy,volume
2009,100000
2010,120000
2011,150000
2012,160000
2013,400000
2014,1000000
db4
dy,volume
2009,250000
2010,400000
2011,750000
2012,900000
2013,1400000
2014,3000000
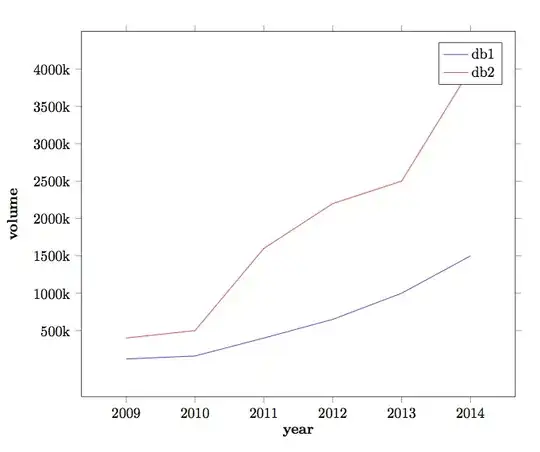
And with these four files I like to create a simple graphical representation like this. I am using dataplot package for this purpose. And here is my source file:
test.tex
\documentclass{book}
\usepackage{dataplot}
\begin{document}
\DTLloaddb{db1}{db1.csv}
\DTLloaddb{db2}{db2.csv}
\DTLloaddb{db3}{db3.csv}
\DTLloaddb{db4}{db4.csv}

\begin{figure}[htbp]
\centering
\DTLplot{db1,db2,db3,db4}{x=dy,y=volume,
width=3in,height=3in,style=lines,legend,legendlabels={Legend1,Legend2,Legend3,Legend4},
xlabel={Year},ylabel={Volume},box,
xticpoints={2009,2010,2011,2012,2013,2014}
}

\caption{A simple graph}

\end{document}
But, I am getting this error over and over saying:
Package datatool Error: Can't assign \DTLthisX : there is no key `dy' in database `db1'.
If there is someone who could help me out in this regard, either pointing my error or any useful information to handle this.
One more question:
As my database contains huge numbers (i.e., > 100000), how can I manage to show this on y-axis as 100k and so on. Where k denotes a kilo. Any ideas.
\addplot file {db1.dat};@Jubobs +1 for nice answer, but it would be nice if the years were written as2009not2,009– Jesper Ipsen Mar 28 '13 at 08:34