I have already emailed the author Alain Matthes regarding this question. But for the benefit of those who might be interested, and since Alain is also a very active member in this site, I am also posting the question here.
In my attempt to answer the question Definite Integral Animation Examples, I borrowed Alain's code in his answer in Tikz-PGF: Draw integral test plot. The code works fine but shows an unexpected behavior when passing the value 1 to the number option as can be seen in the figure.
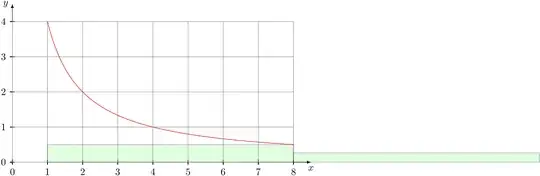
Here, there should be no rectangle after x=8. However, the code works fine when number is set greater than 1.
Here is the complete code for the figure.
\documentclass[tikz]{standalone}
\usepackage{tkz-fct}

\begin{document}
\begin{tikzpicture}[scale=1.25]
\tkzInit[xmax=8,ymax=4]
\tkzAxeXY[ticks=false]
\tkzGrid
\tkzFct[color = red, domain =0.125:8]{4./x}
\tkzDrawRiemannSumInf[fill=green!60,
                     opacity=.2,
                     color=green,
                     line width=1pt,
                     interval=1:8,
                     number=1]
 %\foreach \x/\t in {1.5/$a_1$,2.5/$a_2$,3.5/$a_3$,7.5/$a_7$}
 %\node[green!50!black] at (\x,{4/(\x+1)-0.25}){\t};
\end{tikzpicture}
\end{document}
Can somebody verify this and give a workaround?

\i, I am not so sure, too. Even in the definitions oftkzDrawRiemannSumandtkzDrawRiemannSumSupthere is onlyiinstead of\i. But even ifiis not replaced with\i, it works fine with this example. – hpesoj626 Mar 31 '13 at 10:27