7
\documentclass[a4paper,twoside]{article}
\usepackage{xypic}
\begin{document}

\xymatrix{
A\ar@{-} [rr]  & & D\ar @{-}[r] & E\\
 L\ar @{-}[rrr]              &         &         & M \\
P\ar[rrr]\ar[uu]  & R\ar[ruu] & S & T\ar @{-}[uu]
}

\end{document}  

This produces the following diagram :

Commutative  diagram

But, I would like to produce the diagram below :

Adjusted diagram

How can I do this using the package xypic?

Moriambar
  • 11,466
Soumitra Sen
  • 2,995

2 Answers2

5

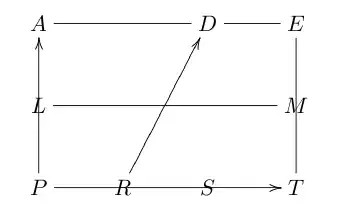
Here is an xypic version of your second diagram.

Sample output

\documentclass[a4paper,twoside]{article}

\usepackage{xypic}

\begin{document}

\begin{xy}<1cm,0cm>:
  (0,0)="P"; (0,2)="A" **@{-};
  (4,2)="E" **@{-}; (4,0)="T" **@{-}; "P" **@{-},
  (0,1)="L"; (4,1)="M" **@{-},
  (1.3,0)="R"; "R"+(0,0.1) **@{-},
  (3,0)="S"; "S"+(0,0.1) **@{-},
  (2.6,2)="D"; "D"-(0,0.1) **@{-},
  (2.2,0) *{>},
  "P"-(0.2,0.2)*{P},
  "L"-(0.2,0)*{L},
  "A"+(-0.2,0.2)*{A},
  "D"+(0,0.2)*{D},
  "E"+(0.2,0.2)*{E},
  "M"+(0.2,0)*[r]{M},
  "T"+(0.2,-0.2)*{T},
  "S"-(0,0.2)*{S},
  "R"-(0,0.2)*{R}
\end{xy}

\end{document}

The first collection of commands draws the lines and provides some reference names for the points. The second collection prints the arrow and the labels. See the Reference Manual of xypic (or texdoc xyrefer on your computer) for more details. This is more helpful than the User Guide (texdoc xypic), which is mostly directed towards creation of so-called "commutative diagrams".

Note the syntax carefully. The line drawing operation **@{-} uses the last two points on a stack; it is followed by ; when we want to continue on from the last point, but by , when we need to start a completely new operation.

I guess you were also asking how to add arrows to this diagram, presumably from R to D, rather than R to P in the comment. One way would be

"R"; "D" **@{-} ?(.7)*\dir{>}

which places the arrow head .7 of the distance from R to D. A comparable construction could be used for the arrow on the bottom line.

Andrew Swann
  • 95,762
3

I don't know xy well, but here's one possibility using TikZ:

\documentclass{article}
\usepackage{tikz}
\usetikzlibrary{positioning,decorations.markings}

\begin{document}

\begin{tikzpicture}[node distance=1cm]
% coordinates for the points
\coordinate (A) ;
\coordinate[right = 2cm of A] (D) ;
\coordinate[right = of D] (E) ;
\coordinate[below = of A] (L) ;
\coordinate[below = of L] (P) ;
\coordinate[right = of P] (R) ;
\coordinate[right = 1.3cm of R] (S) ;
\coordinate[below = of E] (M);
\coordinate[below = of M] (T);
% join some points with straight line segments
\draw (R) -- (P) -- (L) -- (A) -- (D) -- (E) -- (M) -- (T) -- (S);
\draw (L) -- (M);
% draw the segment from R to S with arrow in the middle
\draw[postaction=decorate,decoration={markings,mark=at position 0.5 with {\arrow{>}}}] (R) -- (S);
% draw tick-marks at R,S and D
\draw (R) -- +(0,3pt);
\draw (S) -- +(0,3pt);
\draw (D) -- +(0,-3pt);
% place the labels
\foreach \coor/\posi in {R/below,P/below left,L/left,A/above left,D/above,E/above right,M/right,T/below right,S/below}
  \node[\posi] at (\coor) {\coor};
\end{tikzpicture}

\end{document}

enter image description here

Gonzalo Medina
  • 505,128