22

Is there a way to create something that looks like this? enter image description here

I have looked at the \rotatebox command, but that will not get the same "jagged" edges on the bottom, and looked at How to draw a diagonally-split grid with TikZ? which seems applicable (especially in conjunction with the \rotatebox).

I was able to make this:

enter image description here

With code adapted from the link, but I have no idea how to customize it.

\documentclass[12pt]{article}
\usepackage[english]{babel}
\usepackage{amsfonts}
\usepackage{tikz}
\usepackage{rotating}
\usetikzlibrary{calc,decorations.shapes}
\tikzset{
  decorate with/.style args={#1 separated by #2}{
    fill,
    decorate,decoration={shape backgrounds,shape=#1,shape size=1.5mm,
    shape sep={#2, between borders}}
  }
}

\pgfkeys{/tikz/.cd,
   num quad/.initial=5,
   num quad/.get=\numquad,
   num quad/.store in=\numquad,
}

\begin{document}

\usetikzlibrary{calc,decorations.shapes}
\rotatebox{315}{\begin{tikzpicture}[x=0.5025cm,y=0.5025cm,line cap=round]
    \foreach \x [count=\xi] in {1,...,\numquad}{
      \foreach \y [count=\yi] in {\x,...,\numquad}{
        \node [draw, minimum size=0.5cm,outer sep=0pt,inner sep=0pt] (u-\xi\yi) at (\xi,-\yi) {};
      }
    }
    \end{tikzpicture}
}
\end{document}
soandos
  • 2,211
  • 2
  • 23
  • 35

3 Answers3

21

The diamond shape is only there for drawing and filling, the text is actually only a label (which is actually a node too) to the diamond node.

This works best only with an angle of 45.
One could also solve this with a custom coordinate system (x going ↗, y going ↘) instead of rotation, the squares/diamonds could have been drawn also with a rectangular path.

The size of the shape is manually set to

minimum size=1.414cm+0.4\pgflinewidth

The co-efficient of \pgflinewidth is found empirical and is chosen so that the lines overdraw eachother, as a grid would do that.

Update:
The macro that is used by remember isn't remembered anymore after the loops. I'm using global remember for this. (The key remember=\macro is still needed since global remember doesn't apply the same parsing that remember does.)

To add j → and m → I've used my custom /utils/exec={<cond>}{<true keys>}{<false keys>} key to add a label to a label. (We could've used \ifnum here, too, or we could also replace the \ifnums by /utils/ifs.)

The mathtools package is loaded for \mathrlap to easily place the →-labels.

Code

\documentclass[tikz]{standalone}
\usepackage{mathtools}
\usetikzlibrary{shapes.geometric}
\makeatletter
\pgfqkeys{/pgf/foreach}{
  global remember/.code=%
    \pgfutil@append@tomacro{\pgffor@remember@code}{\gdef\noexpand#1{#1}}}
\pgfqkeys{/utils}{if/.code n args={3}{%
  \pgfmathifthenelse{#1}{1}{0}\ifnum\pgfmathresult=0 
  \expandafter\pgfutil@secondoftwo\else\expandafter\pgfutil@firstoftwo\fi
  {\pgfkeysalso{#2}}{\pgfkeysalso{#3}}}}
\makeatother
\begin{document}
\begin{tikzpicture}[
    rotate=-45,
    every label/.append style={text depth=+0pt},
    label position=center,
    every cell/.style={fill=gray!25},
    column 3/.style={fill=red!25},
    row 5/.style={fill=green!25},
    cell 2-2/.style={fill=gray},
    cell 3-2/.style={fill=gray!50},
    ]
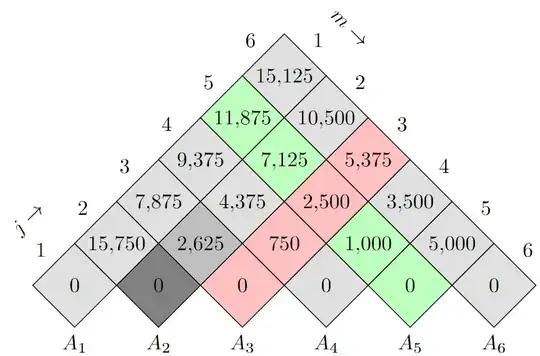
\foreach \jRow[count=\jCount from 1, remember=\jCount, global remember=\jCount] in {%
        0,%
        {15750,0},%
        {7875,2625,0},%
        {9375,4375,750,0},%
        {11875,7125,2500,1000,0},%
        {15125,10500,5375,3500,5000,0}%
    } {
    \foreach \mCell[count=\mCount from 1, remember=\mCount] in \jRow {
        \node[
            diamond,
            minimum size=1.414cm+0.4\pgflinewidth,
            draw,
            every cell/.try,
            row \jCount/.try,
            column \mCount/.try,
            cell \jCount-\mCount/.try,
            label={\pgfmathprintnumber{\mCell}},
            alias=@lastnode,
            alias=@lastrow-\mCount
        ] at (\mCount-.5,\jCount-.5) {};
        \ifnum\mCount=1
            \path [late options={name=@lastnode,
              label={
                [/utils/if={\jCount==1}%
                  {label={[rotate=45,anchor=south]above left:$j\mathrlap{{}\to}$}}{}]
                above left:$\jCount$}}];
        \fi
    }
        \path [late options={name=@lastnode, label=below:$A_\jCount$}];
    }
    \foreach \jCountExtra in {1,...,\jCount}
        \path [late options={name=@lastrow-\jCountExtra, label={
          [/utils/if={\jCountExtra==1}%
            {label={[rotate=-45,anchor=south]above right:$m\mathrlap{{}\to}$}}{}]
           above right:$\jCountExtra$}}];
\end{tikzpicture}
\end{document}

Output

enter image description here

Qrrbrbirlbel
  • 119,821
18

TikZ has a rotate option. Here is an example:

% without rotate
\begin{tikzpicture}[y={(0, -1)}]
    \path (0.5, -0.5) node{1} ++(1, 0) node{2};
    \path (-0.5, 0.5) node{1} ++(0, 1) node{2};
    \draw (0, 2) grid (2, 0);
    \node at (0.5, 0.5) {$12.34$};
    \node at (2.5, 2.5) {$A_1$};
\end{tikzpicture}

% with rotate
\begin{tikzpicture}[y={(0, -1)}, rotate=-45]
    \path (0.5, -0.5) node{1} ++(1, 0) node{2};
    \path (-0.5, 0.5) node{1} ++(0, 1) node{2};
    \draw (0, 2) grid (2, 0);
    \node at (0.5, 0.5) {$12.34$};
    \node at (2.5, 2.5) {$A_1$};
\end{tikzpicture}

And the results:

enter image description here


Update:

\begin{tikzpicture}[y={(0, -1)}, rotate=-45]
    \path (0.5, -0.5) node{1} ++(1, 0) node{2};
    \path (-0.5, 0.5) node{1} ++(0, 1) node{2};
    \foreach \y in {0,...,2} {
        \foreach \x in {0,...,\y} {
            \draw (\x, \y - \x) rectangle +(1, 1);
        }
    }
    \node at (0.5, 0.5) {$12.34$};
    \node at (2.5, 2.5) {$A_1$};
\end{tikzpicture}

Result:

enter image description here

SaltyEgg
  • 947
2

Here is a solution with nicematrix. The tabular is constructed as a classical tabular. Then it is rotated by -45°. Each cell of the tabular is rotated by 45° in order to have horizontal text.

\documentclass{article}
\usepackage{nicematrix,tikz,collcell}

\begin{document}

\NiceMatrixOptions { code-for-first-col = \rotatebox{45}{\arabic{iRow}}, code-for-first-row = \rotatebox{45}{\arabic{jCol} \rule[-5mm]{0mm}{5mm}} }

\newcolumntype{K}{>{\collectcell\Rotate}c<{\endcollectcell}}

\newcommand{\Rotate}[1]{\rotatebox[origin=c]{45}{\OnlyMainNiceMatrix{\rule[-10.6mm]{0mm}{21.2mm}\clap{#1}}}}

\rotatebox{-45} { \tabcolsep=0pt \begin{NiceTabular}{KKKKKK}% [ hvlines,corners=SE,first-row,first-col,columns-width=15mm ] \CodeBefore \arraycolor{gray!10} \cellcolor{gray!80}{5-2,2-3} \cellcolor{gray!60}{4-2,2-4} \cellcolor{gray!40}{3-2,2-5} \Body & 1 & 2 & 3 & 4 & 5 & 6 \ & 15.125 & 10.500 & 5.375 & 3.500 & 5.000 & 0 \ & 11.875 & 7.215 & 2.500 & 1.000 & 0 \ & 9.375 & 4.375 & 750 & 0 \ & 7.875 & 2.625 & 0 \ & 15.750 & 0 \ & 0 \ \CodeAfter \begin{tikzpicture} [every node/.style = {below,rotate=45}] \node at (7-|2) {$A_1$} ; \node at (6-|3) {$A_2$} ; \node at (5-|4) {$A_3$} ; \node at (4-|5) {$A_4$} ; \node at (3-|6) {$A_5$} ; \node at (2-|7) {$A_6$} ; \end{tikzpicture} \end{NiceTabular} }

\end{document}

You need several compilations (because nicematrix uses PGF/Tikz nodes under the hood).

Output of the above code

You can also put the instructions \cellcolor in the main tabular, that is to say in the corresponding cells as you would do with the command \cellcolor of colortbl.

\documentclass{article}
\usepackage{nicematrix,tikz,collcell}

\begin{document}

\NiceMatrixOptions { code-for-first-col = \rotatebox{45}{\arabic{iRow}}, code-for-first-row = \rotatebox{45}{\arabic{jCol} \rule[-5mm]{0mm}{5mm}} }

\newcolumntype{K}{>{\collectcell\Rotate}c<{\endcollectcell}}

\newcommand{\Rotate}[1]{\rotatebox[origin=c]{45}{\OnlyMainNiceMatrix{\rule[-10.6mm]{0mm}{21.2mm}\clap{#1}}}}

\rotatebox{-45} { \tabcolsep=0pt \begin{NiceTabular}{KKKKKK}% [ hvlines,corners=SE,first-row,first-col,columns-width=15mm, colortbl-like ] \CodeBefore \arraycolor{gray!10} \Body & 1 & 2 & 3 & 4 & 5 & 6 \ & 15.125 & 10.500 & 5.375 & 3.500 & 5.000 & 0 \ & 11.875 & 7.215 & \cellcolor{gray!80} 2.500 & \cellcolor{gray!60} 1.000 & \cellcolor{gray!40}0 \ & 9.375 & \cellcolor{gray!40} 4.375 & 750 & 0 \ & 7.875 & \cellcolor{gray!60} 2.625 & 0 \ & 15.750 & \cellcolor{gray!80} 0 \ & 0 \ \CodeAfter \begin{tikzpicture} [every node/.style = {below,rotate=45}] \node at (7-|2) {$A_1$} ; \node at (6-|3) {$A_2$} ; \node at (5-|4) {$A_3$} ; \node at (4-|5) {$A_4$} ; \node at (3-|6) {$A_5$} ; \node at (2-|7) {$A_6$} ; \end{tikzpicture} \end{NiceTabular} }

\end{document}

The output is the same.

F. Pantigny
  • 40,250