2

Based on a previously asked question by me I already have the following code:

\documentclass [11pt,a4paper] {article}
\usepackage[usenames,dvipsnames,svgnames,table]{xcolor}
\usepackage{amsmath,tikz}
\usepackage[margin=1cm]{geometry}
\usepackage{collcell}
\usetikzlibrary{patterns,matrix,arrows}
\begin{document}
\begin{tikzpicture}[->,>=stealth',shorten >=1pt,auto,node distance=3cm,
  thick,main node/.style={circle,fill=RoyalBlue!90!green!80,draw,font=\sffamily\Large\bfseries}]
  \node[main node] [label=above:Cause](1) {Y};
  \node[main node] [label=above:Effect](2) [right of=1] {$X$};
  \node[main node] [](3)[above=1] {$N_X$};
  \node[main node] [](4)[above=2] {$N_Y$};

  \path[every node/.style={font=\sffamily\small}]
    (1)edge [right] node[below right] {$\varphi$} (2);
  \path[every node/.style={font=\sffamily\small, color=orange}]
    (2)edge[bend right,color=orange]node[above] {$\varphi^{-1}$} (1);
  \path[every node/.style={font=\sffamily\small, color=orange}]
    (3)edge[color=red]node[below] {id} (1);
  \path[every node/.style={font=\sffamily\small, color=orange}]
    (4)edge[color=blue]node[below] {} (2);
\end{tikzpicture}
\end{document}

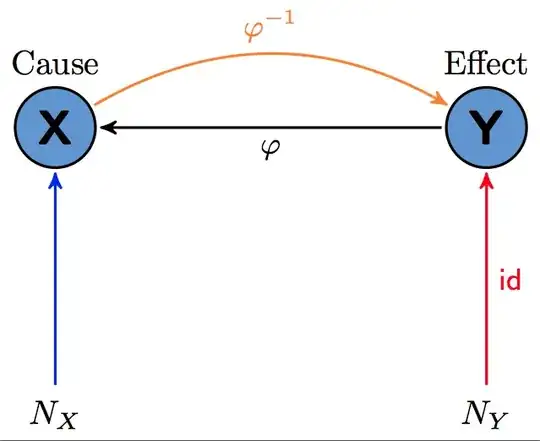
However I want to be able to add two nodes without borders as depicted in the following diagram to my diagram:

enter image description here

As you probably figured it by now, I don't know why but my code puts the circles above each other though I positioned them(3 and 4) relative to two different nodes(1 and 2). and also I don't know how to make the circles disappear and to only keep labels. I have to add that I am happy with the connections between nodes 1 and 2 and the colors of them. I only need the new connections and nodes.

Naji
  • 1,505

3 Answers3

7

I don't understand what should happen here but you should not use numbers as node names. That's why above=1 didn't give you any errors because it automatically assumes it 1cm and draws nonsense. There are many strange syntax used in the MWE so here is a little bit tidied up version but still I don't know what the goal is.

\PassOptionsToPackage{usenames,dvipsnames,svgnames,table}{xcolor}
\documentclass [11pt,a4paper] {article}
\usepackage{amsmath,tikz}

\usetikzlibrary{patterns,matrix,arrows}
\begin{document}
\begin{tikzpicture}[->,
  >=stealth',
  shorten >=1pt,
  auto,
  node distance=3cm,
  thick,
  main node/.style={
              circle,
              fill=RoyalBlue!90!green!80,
              draw,
              font=\sffamily\Large\bfseries}
 ]
  \node[main node,label=above:Cause]             (y)  {Y};
  \node[main node,label=above:Effect,right of=y] (x)  {$X$};
  \node[below of=x]                              (nx) {$N_X$};
  \node[below of=y]                              (ny) {$N_Y$};

  \path (y)  edge[right] node[below right,font=\sffamily\small] {$\varphi$} (x);
  \path (x)  edge[bend right,orange]node[above,font=\sffamily\small,orange]{$\varphi^{-1}$}(y);
  \path (nx) edge[red] node[left,font=\sffamily\small,orange] {id} (x);
  \path (ny) edge[blue] (y);
\end{tikzpicture}
\end{document}

enter image description here

percusse
  • 157,807
  • I didn't know of that autocorrection!! – Naji May 03 '13 at 18:29
  • Good point about nodes named as numbers. – Matthew Leingang May 03 '13 at 18:30
  • @percusse I do have a problem. As I can see node distances are not part of the style. How should I decrease the lenght of edges from N_X and N_Y comparing to the one between X and Y? – Naji May 03 '13 at 18:37
  • 1
    @Naji: You can also use below=<dimen> of 1 to make the separation anything you want. – Matthew Leingang May 03 '13 at 18:40
  • 1
    @Naji What Matthew said. Also have a look at this before going deeper about positioning library syntax difference http://tex.stackexchange.com/questions/9386/difference-between-right-of-and-right-of-in-pgf-tikz – percusse May 03 '13 at 18:43
4

If you don't want nodes 3 and 4 to be styled the same way as 1 and 2 then don't use the main node style on them. For the positioning, use below=of 1 instead of above=1 and it should work out.

Also, you can combine your \paths into a single one and use the scoping properties to limit the repetition.

\documentclass{standalone}
\usepackage[usenames,dvipsnames,svgnames,table]{xcolor}
\usepackage{amsmath,tikz}
\usetikzlibrary{patterns,matrix,arrows,positioning}
\begin{document}
\begin{tikzpicture}[->,>=stealth',shorten >=1pt,auto,node distance=3cm,
  thick,main node/.style={circle,fill=RoyalBlue!90!green!80,draw,font=\sffamily\Large\bfseries}]
  \node[main node] [label=above:Cause](1) {Y};
  \node[main node] [label=above:Effect](2) [right of=1] {X};
  \node(3)[below=2cm of 1] {$N_X$};
  \node(4)[below=2cm of 2] {$N_Y$};

  \path[every node/.style={font=\sffamily\small}]
    (1) edge [right] node[below right] {$\varphi$} (2)
    (2) edge [bend right,color=orange] node[above] {$\varphi^{-1}$} (1)
    (3) edge [color=red] node[right] {id} (1)
    (4) edge[color=blue] (2);
\end{tikzpicture}
\end{document}

sample code output

Matthew Leingang
  • 44,937
  • 14
  • 131
  • 195
4

Here a variant without positioning, without this library it's more easy to scale the graph and finally the code is more easy to read at (3,-2) is shorter than below=2cm of 1. Possible is \def\deltax{3} \def\deltay{-2}

\documentclass{standalone}
\usepackage[usenames,dvipsnames,svgnames,table]{xcolor}
\usepackage{tikz}
\usetikzlibrary{arrows}
\begin{document}

\begin{tikzpicture}[->,>=stealth',shorten >=1pt,shorten <=1pt,auto,
  scale=2,thick,
  main/.style={circle,fill=RoyalBlue!90!green!80,draw,font=\sffamily\Large\bfseries}]
  \node[main] [label=above:Cause]  (x)  at (0,0)  {X};
  \node[main] [label=above:Effect] (y)  at (3,0)  {Y};
  \node                            (nx) at (0,-2) {$N_X$};
  \node                            (ny) at (3,-2) {$N_Y$};

  \path [every node/.style={font=\sffamily\small}]
     (x)  edge [<-,right]               node[below] {$\varphi$}      (y)
          edge [bend left,color=orange] node[above] {$\varphi^{-1}$} (y)
          edge [<-,color=blue]                                       (nx)
     (ny) edge [color=red] node[right] {id} (y) ;
\end{tikzpicture}
\end{document}

enter image description here

Alain Matthes
  • 95,075