I am currently playing around with hailstone sequences (collatz numbers).
I would like to create a plot like this (from Wikipedia):

But I don't know how this kind of plot is called (it's neither a line plot, nor a scatter plot or a bar chart or a histogram, although it looks similar).
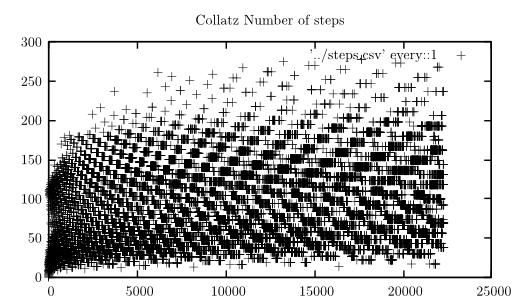
I would like to plot how many steps you need from a number n to get to 1. The x-axis should be numbers (from 1 to M, with M as high as possible) and the y-axis should be the number of steps.
As I didn't know how the kind of plot above is called (and I was not able to find a name) I used a scatterplot:

Sadly, this seems to consume a lot of memory. Plotting 4100 (n, steps from n to 1) pairs worked, but when I increased it to 4150 pairs, I got:
! TeX capacity exceeded, sorry [main memory size=3000000].
\endvarwidth ...\vbox \bgroup \unvcopy \@tempboxa
                                                  \@tempdima -\maxdimen \let...
l.28 \end{document}
I think the following could eventually solve my problem:
- switch to gnuplot (I have no idea how to read a CSV-file with gnuplot and I only used gnuplot+LaTeX once. Does anybody have a minimal working example with instructions how to compile it?)
- switch diagram type to the diagram above (How is it called?)
- don't actually write the numbers n in csv file, but get it from the line number (How can I get the line number from a CSV file in my code below for x?)
- switch to another type of plot like here (I guess this will be more complicated and it seems as if I had to use gnuplot / R. Does anybody know how to apply this to my problem?)
All code I've written is on GitHub. This is the LaTeX code I've written so far:
\documentclass[varwidth=true, border=2pt]{standalone}
\usepackage[utf8]{inputenc} % this is needed for umlauts
\usepackage[ngerman]{babel} % this is needed for umlauts
\usepackage[T1]{fontenc}    % this is needed for correct output of umlauts in pdf
\usepackage[margin=2.5cm]{geometry} %layout

\usepackage{pgfplots}

\begin{document}
\begin{tikzpicture}
    \begin{axis}[
            axis x line=middle,
            axis y line=middle,
            enlarge y limits=true,
            %xmin=0, xmax=2150,
            %ymin=0, ymax=600,
            width=15cm, height=8cm,     % size of the image
            grid = major,
            grid style={dashed, gray!30},
            ylabel=steps,
            xlabel=$n$,
            legend style={at={(0.1,-0.1)}, anchor=north}
         ]
          \addplot[scatter,only marks] table [x=n, y=steps, col sep=comma] {../steps.csv};
    \end{axis}
\end{tikzpicture}
\end{document}
I would like to plot at least 100,000 elements (rather 10,000,000 if possible). How can I do it?


pgfplotsmanual)? – Torbjørn T. May 16 '13 at 09:27