Everything is all right before I updated all my MiKTeX package to latest version. But after that, I find that all .eps file generated by Matlab cannot be shown correctly.
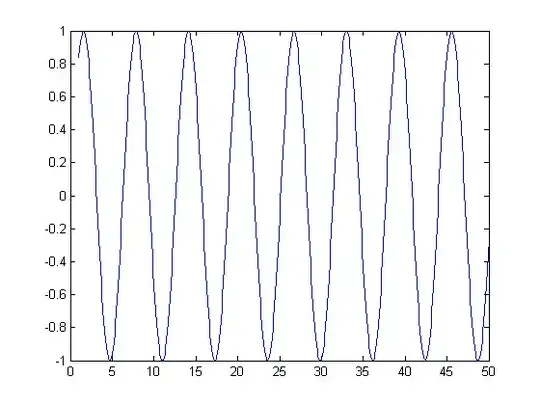
For example. I use Matlab to plot sin(n)
n = 1:0.1:50;
plot(n, sin(n));
And I got the figure like this.
I use Matlab 2013a(tested in 2011b as well).
I save this figure by File-> Save As...-> test.eps.
But when I use LaTeX to generate .pdf file with this piece of code
\documentclass[a4paper]{article}
\usepackage{graphicx}
\begin{document}
test1
\begin{figure}
 \begin{center}
  \includegraphics[height=140mm]{test.eps}
 \end{center}
\end{figure}
test2
\end{document}
I use xelatex to compile my .tex file, and got a pdf like this
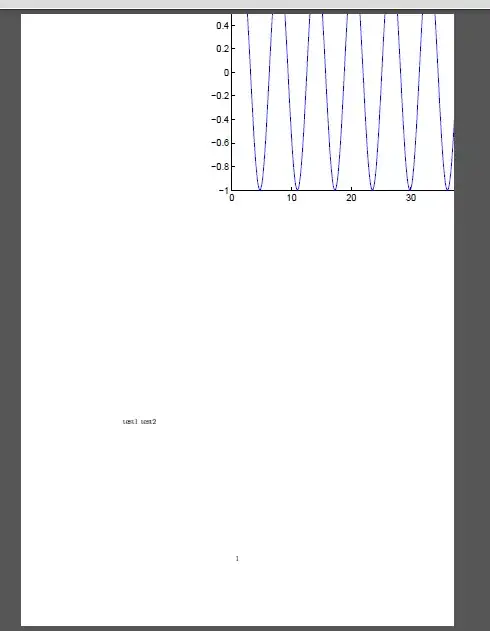
The .eps file is shown at wrong position. "center" seems to be useless. I have done other tests, which prove that .eps file generated by other software(Word, Adobe Acrobat) can be shown correctly. Therefore, I think the problem may lie in Matlab. Perhaps the .eps file generated by Matlab is not compatible with some tex package.
This subtle problem has wasted me much time. Does anybody know why and how to solve the problem ? Thanks!
\begin{center}...\end{center}you better use\centering. This does not solve your problem, though. – mafp May 29 '13 at 21:07