Here are a collection of settings that would fix tiny details. You can comment them out to see what they are doing. The arrow heads are from DIN conform arrowheads and hatching in TikZ?
\documentclass{standalone}
\usepackage{pgfplots}
\pgfplotsset{compat=1.8}
\makeatletter
% https://tex.stackexchange.com/questions/52786/din-conform-arrowheads-and-hatching-in-tikz
\pgfarrowsdeclare{DIN}{DIN}
{
\pgfutil@tempdima=0.5pt%
\advance\pgfutil@tempdima by.25\pgflinewidth%
\pgfutil@tempdimb=7.29\pgfutil@tempdima\advance\pgfutil@tempdimb by.5\pgflinewidth%
\pgfarrowsleftextend{+-\pgfutil@tempdimb}
\pgfutil@tempdimb=.5\pgfutil@tempdima\advance\pgfutil@tempdimb by1.6\pgflinewidth%
\pgfarrowsrightextend{+\pgfutil@tempdimb}
}
{
\pgfutil@tempdima=0.5pt%
\advance\pgfutil@tempdima by.25\pgflinewidth%
\pgfsetdash{}{+0pt}
\pgfsetmiterjoin
\pgfpathmoveto{\pgfpointadd{\pgfqpoint{0.5\pgfutil@tempdima}{0pt}}{\pgfqpoint{-4mm}{0.5mm}}}
\pgfpathlineto{\pgfqpoint{0.5\pgfutil@tempdima}{0\pgfutil@tempdima}}
\pgfpathlineto{\pgfpointadd{\pgfqpoint{0.5\pgfutil@tempdima}{0pt}}{\pgfqpoint{-4mm}{-0.5mm}}}
\pgfpathclose
\pgfusepathqfillstroke
}
\pgfarrowsdeclarereversed{DIN reversed}{DIN reversed}{DIN}{DIN}
\makeatother
\begin{document}
\begin{tikzpicture}
\begin{axis}[
symbolic x coords={excellent, good, average, bad, awful},
ylabel = {probability},
xlabel = {Quality},
ytick=\empty,ymin=0,
axis x line=bottom,
axis y line=left,
enlarge x limits=0.2,
axis line style={-DIN,ultra thin},
xtick=data,
nodes near coords={\pgfmathprintnumber\pgfplotspointmeta\%},
ylabel near ticks,
xticklabel style={anchor=base,yshift=-3mm},
xtick style={draw=none},
every axis x label/.style={at={(current axis.south east)},anchor=north west}
]
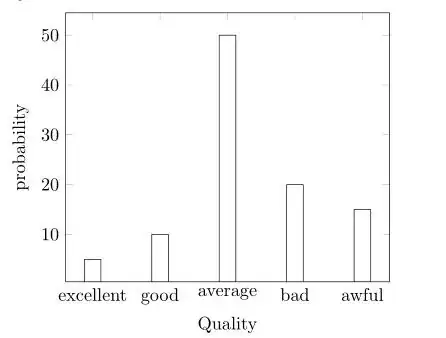
\addplot[ybar,fill=white] coordinates {
(excellent,5)
(good,10)
(average,50)
(bad, 20)
(awful,15)
};
\end{axis}
\end{tikzpicture}
\end{document}