My feeling is that the plot operation is special and the way in which TikZ process it differs with respect to how canonical paths are processed. Quoting the manual:
The plot path operation can be used to append a line or curve to the path that goes through a large number
of coordinates.
This suggests that the whole plot is appended to the path and thus that could be a possible reason why nodes can be appended only at the beginning or at the end of a plot path.
However, it is always possible to exploit the decorations.markings library as a workaround.
An example:
\documentclass[tikz,png,border=10pt]{standalone}
\usetikzlibrary{decorations.markings}
\tikzset{insert node/.style args={#1 at #2}{
postaction=decorate,
decoration={
markings,
mark= at position #2
with
{
#1
}
}
}
}
\begin{document}
\begin{tikzpicture}
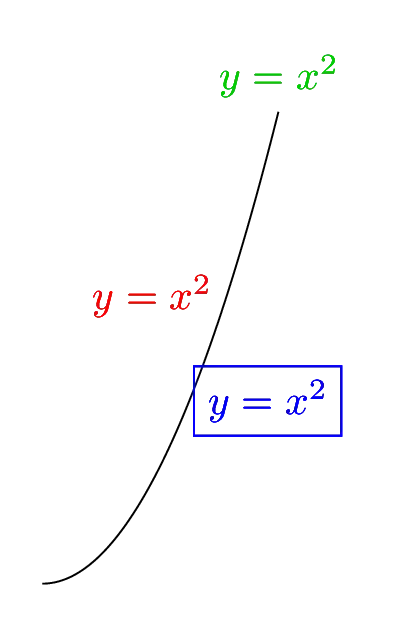
\draw[insert node={\node[red,left]{\(y = x^2\)};} at 0.65,
insert node={\node[blue,draw,right]{\(y = x^2\)};} at 0.45,
insert node={\node[green!80!black,above]{\(y = x^2\)};} at 1,
] plot[domain = 0:2, samples = 100] ({\x}, {(\x)^2});
\end{tikzpicture}
\end{document}
The result: