How can one draw orthogonal tick marks on a function? For instance in the following plot I would like to make orthogonal tick marks on the function y=x^2, say.
\documentclass{article}
\usepackage{tikz}
\begin{document}
\begin{tikzpicture}
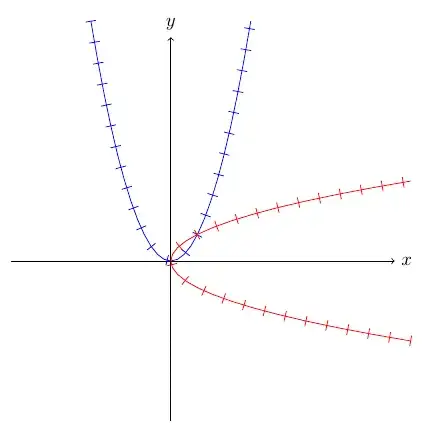
\draw[->] (-3,0) -- (4.2,0) node[right] {$x$};
\draw[->] (0,-3) -- (0,4.2) node[above] {$y$};
\draw[scale=0.5,domain=-3:3,smooth,variable=\x,blue] plot ({\x},{\x*\x});
\draw[scale=0.5,domain=-3:3,smooth,variable=\y,red] plot ({\y*\y},{\y});
\end{tikzpicture}
\end{document}
I kind of know it will involve \foreach, but I am not sure how to proceed.
To make things clear, I would like to have the tick marks "following" the graph of the function. Also if there are two or more functions on the same plot, then each should have a separate option for decoration. Please see comments below.
\foreach x on the graph of "f" draw a vector at angle \theta with spacing S between the vectors.
– Physics_maths Nov 13 '13 at 13:20\documentclass{...}and ending with\end{document}. That may seem tedious to you, but think of the extra work it represents for TeX.SX users willing to help you. Help them help you: remove that one hurdle between you and a solution to your problem. – jub0bs Nov 13 '13 at 13:30