I'm having some trouble with polar plots. I have to plot negative values, but without changing direction. I tried to set the ymin value to be negative, but it doesn't work.
\documentclass[10pt,border=10pt]{standalone}
\usepackage{pgfplots}
\usepgfplotslibrary{polar}

\begin{document}
\begin{tikzpicture}
\begin{polaraxis}[
   xticklabel=$\pgfmathprintnumber{\tick}^\circ$,
   ymin=-10,
   xtick={0,30,...,330}]
\addplot table{
   0  -1
   30 -2
   45 -3
   60 -4
   75 -5
   };
\end{polaraxis}
\end{tikzpicture}
\end{document}
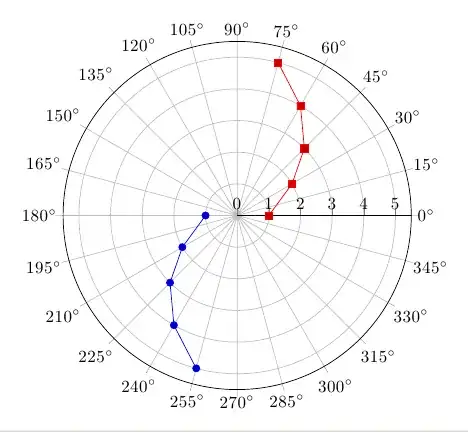
Any suggestion?
For clarity, this is what I expected.