If you don't mind the Python based matplotlib example referred to above (note, there are more pleasant looking graphics here) then sagetex is an option since it allows you to run Python code.
\documentclass{article}
\usepackage{sagetex}
\usepackage{graphicx}
\pagestyle{empty}
\begin{document}
\begin{sagesilent}
from mpl_toolkits.mplot3d import axes3d
import matplotlib.pyplot as plt
from matplotlib import cm
fig = plt.figure()
ax = fig.gca(projection='3d')
X, Y, Z = axes3d.get_test_data(0.05)
ax.plot_surface(X, Y, Z, rstride=8, cstride=8, alpha=0.3)
cset = ax.contourf(X, Y, Z, zdir='z', offset=-100, cmap=cm.coolwarm)
cset = ax.contourf(X, Y, Z, zdir='x', offset=-40, cmap=cm.coolwarm)
cset = ax.contourf(X, Y, Z, zdir='y', offset=40, cmap=cm.coolwarm)
ax.set_xlabel('X')
ax.set_xlim(-40, 40)
ax.set_ylabel('Y')
ax.set_ylim(-40, 40)
ax.set_zlabel('Z')
ax.set_zlim(-100, 100)
plt.savefig('Contour.png')
\end{sagesilent}
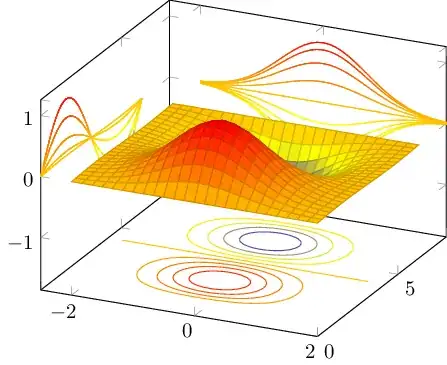
Sagetex let's you borrow the power of Python in creating pictures. This
example comes from:
\begin{verbatim}
http://matplotlib.org/mpl_toolkits/mplot3d/tutorial.html#surface-plots
\end{verbatim}
and it's running in \LaTeX \,with the power of the sagetex package.
\begin{center}
\includegraphics[width=5in,height=4in]{Contour.png}
\end{center}
\end{document}
Which gives this output when running on the Sagemath Cloud site: