2

I would like to plot the normal and tangent lines on a smooth cycle. So far, I have this :

enter image description here

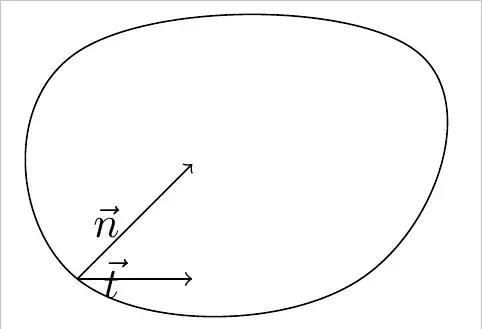
As you can see, the normal well done, by the tangent isn't, what's the good setup for it ?

\documentclass[11pt]{standalone}   
\usepackage{tikz}       
 \usetikzlibrary{arrows}      
\begin{document}
 \begin{tikzpicture} %[allow upside down]

    \draw plot [smooth cycle, tension=0.8] coordinates {(2.5,0) (0,0) (0,2) (3,2)}
      node[sloped,inner sep=0cm,below,pos=0,
          anchor=south west,
          minimum height=1cm,minimum width=1cm](N){};

    \path[->] (N.south west) edge node[left] {$\vec{ n}$} (N.north east);
    \path[->] (N.south west) edge node[left] {$\vec{ t}$} (N.south east);


 \end{tikzpicture}
\end{document}
Thomas
  • 1,633
  • If you use draw as option to node you will see why it is not working. Also, connecting node vertexes how could you know if the arrow are tangent? – Sigur Feb 09 '14 at 13:51
  • @Sigur thanks for your answer, so I have to define a different node for the tangent and the normal lines ? – Thomas Feb 09 '14 at 13:54
  • Change the node anchor to center instead of south west and then you can use the top and bottom corners as ending points for the arrows. But in my opinion the result is not normal neither tangent. The angle between the vectors is 90 but the curve curvature at that point is a little bit different. – Sigur Feb 09 '14 at 13:58
  • The pos key only works with line-to, arc, curve-to and horizontal/vertical line-to operations. For all other path construction operations, the position placement does not work, currently. – Paul Gaborit Feb 09 '14 at 14:12
  • Yes that's what I've just seen, the only key for this plot is to define a node on one of the control coordinates – Thomas Feb 09 '14 at 14:14
  • Maybe this is helpful: http://tex.stackexchange.com/q/74534/36686 – Bordaigorl Feb 09 '14 at 18:16
  • However if the point is not arbitrary but can be choosen as one of the points you use to generate the smooth curve I would proceed as follows: I would take three subsequent such points say A B and C. Then if you draw a line on B parallel to A--C you should get a tangent; then rotate 90° to get the normal. – Bordaigorl Feb 09 '14 at 18:17

3 Answers3

5

Not so satisfactory approach but it could fake a little bit.

\documentclass[11pt]{standalone}   
\usepackage{tikz}       
\usetikzlibrary{arrows}      

\begin{document}
 \begin{tikzpicture}    
  \draw plot [smooth cycle, tension=0.8] coordinates {(2.5,0) (0,0) (0,2) (3,2)}
 node[sloped,inner sep=0cm,below,
      anchor=center,draw,                %% anchor changed. remove draw
      minimum height=1cm,minimum width=1cm](N){};
  \draw[->] (N.center) --  (N.north east) node[left=3pt] {$\vec{n}$};
  \draw[->] (N.center) --  (N.south east) node[left=3pt] {$\vec{t}$};
 \end{tikzpicture}
\end{document}

enter image description here

enter image description here

Thomas
  • 1,633
Sigur
  • 37,330
5

I can't help but point out that this is quite easy using Asymptote; there is a dir(path,real) command that provides the unit tangent vector to a given path at a given time. (Path times between 2 and 3, for instance, give points on the path between the second and third node used to construct it.)

\documentclass[margin=10pt]{standalone}
\usepackage{asymptote}
\begin{document}
\begin{asy}
unitsize(2cm);
path g = reverse((2.5,0)..tension 1.5 .. (0,0) .. (0,2) .. tension 1.5 .. (3,2) .. cycle);
draw(g);
real[] times = new real[] {0, 0.6, 0.9, 1.7, 2.9, 3.4};
for (real t : times) {
  pair tangent = 0.7*dir(g,t);
  pair normal = rotate(90)*tangent;

  draw(shift(point(g,t)) * ((0,0)--tangent), arrow=Arrow(TeXHead), L="$\vec{t}$");
  draw(shift(point(g,t)) * ((0,0)--normal),  arrow=Arrow(TeXHead), L="$\vec{n}$");
}
\end{asy}
\end{document}

enter image description here

  • thanks for this tip, I'll probably try to learn asymptote soon, it seems more powerful for this kind of problem – Thomas Feb 09 '14 at 21:21
4

If you do not need to do this for an arbitrary point in the curve you can choose a point that you use to construct the smooth curve and then use three subsequent such points to derive the tangent and the normal with calc:

\documentclass[11pt]{standalone}   
\usepackage{tikz}       
 \usetikzlibrary{arrows}    
 \usetikzlibrary{calc}    

\newcommand{\normtang}[3]{
    \draw[->, red] (#2) -- ($(#1)!(#2)!(#3)!.5!(#2)$);
    \draw[->, red] (#2) -- ($(#1)!(#2)!90:(#3)!.5!(#2)$);
}  
\begin{document}
 \begin{tikzpicture} %[allow upside down]

    \path[font={\tiny}]
        (2.5 , 0)   coordinate (A)
        (0   , 0)   coordinate (B)
        (0   , 2)   coordinate (C)
        (3   , 2)   coordinate (D)
        %...
    ;
    \draw plot [smooth cycle, tension=0.8] coordinates {(A) (B) (C) (D)};

    \normtang{D}{A}{B}
    \normtang{A}{B}{C}
    \normtang{B}{C}{D}
    \normtang{C}{D}{A}

 \end{tikzpicture}
\end{document}

Which gives:

Result

Bordaigorl
  • 15,135