Here's a first stab at a tikz solution. It is crude and I'm sure there are libraries that would tidy this up no end! The standalone document class and the scale are just to get the picture looking big enough...
\documentclass[border=5em]{standalone}
\usepackage{tikz}
\usetikzlibrary{positioning,calc}
\begin{document}
\begin{tikzpicture}[scale=3]
  \node (a)  {$A$};
  \node  (b) [right=of a] {$B$};
  \node (midpoint) at ($(a)!.5!(b)$) {};
  \node (psi) [above=.5cm of midpoint] {$\psi$};
  \draw[->] (a) -- (b);
\draw[->] (a.north east) parabola bend (psi.south) (b.north west);
\draw[->,shorten <=3pt] (psi.south) -- (midpoint.north);
\end{tikzpicture}
\end{document}
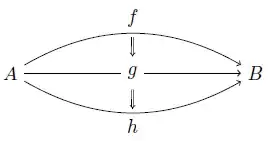
I'm using the positioning library to be able to use constructions like \node (b) [right=of a] {$B}; which allows me to position a node (b) relative to the position of (a).
I'm using the calc library to allow to easily work out the midpoint of the line from a to b with the $(a)!.5!(b)$ construction. Other numbers put in the middle there will identify points nearer to a or b... This answer contains some good examples of using the calc library.
I draw a parabola that starts at a and then bends south of the psi node, which is above the midpoint before coming to an end at b.
Then I draw another line that starts just south of psi (and then some: I shorten the begining of the path because otherwise it actually overlaps with where the previous line bended...). The line continues to just north of midpoint.
It should be obvious how to make the other half: make a node below the midpoint and then do roughly the same thing...