7

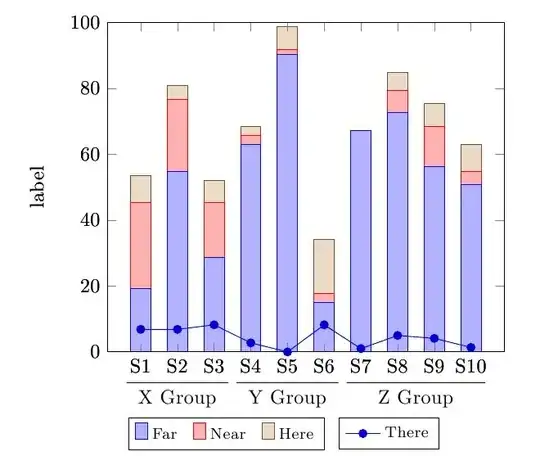
I need to superimpose a line graph over a stacked grouped bar graph (similar to answer to the question: Two level labels in bar plot).

I have to superimpose a line graph for each group (it breaks at boundary of group). For example: First line graph connects S1, S2, S3; Second connects S4, S5, S6; and last one connects S7, S8, S9, S10.

[Edit]

I have managed to superimpose line graph on stacked bar graph. But I need a non-continuous line graph.

Currently, points (S3,S4), (S6,S7) are also connected, which I don't want in my graph. How can I generate a graph like that?

\documentclass{article}

\usepackage{tikz}
\usepackage{pgfplots}

\makeatletter
\newcounter{groupcount}
\pgfplotsset{
    draw group line/.style n args={5}{
        after end axis/.append code={
            \setcounter{groupcount}{0}
            \pgfplotstableforeachcolumnelement{#1}\of\datatable\as\cell{%
                \def\temp{#2}
                \ifx\temp\cell
                    \ifnum\thegroupcount=0
                        \stepcounter{groupcount}
                        \pgfplotstablegetelem{\pgfplotstablerow}{[index]0}\of\datatable
                        \coordinate [yshift=#4] (startgroup) at (axis cs:\pgfplotsretval,0);
                    \else
                        \pgfplotstablegetelem{\pgfplotstablerow}{[index]0}\of\datatable
                        \coordinate [yshift=#4] (endgroup) at (axis cs:\pgfplotsretval,0);
                    \fi
                \else
                    \ifnum\thegroupcount=1
                        \setcounter{groupcount}{0}
                        \draw [
                            shorten >=-#5,
                            shorten <=-#5
                        ] (startgroup) -- node [anchor=north] {#3} (endgroup);
                    \fi
                \fi
            }
            \ifnum\thegroupcount=1
                        \setcounter{groupcount}{0}
                        \draw [
                            shorten >=-#5,
                            shorten <=-#5
                        ] (startgroup) -- node [anchor=north] {#3} (endgroup);
            \fi
        }
    }
}
\makeatother

\pgfplotstableread{
1   19.178  26.027  8.219   6.849   39.726  1
2   54.795  21.918  4.110   6.849   12.329  1
3   28.767  16.438  6.849   8.219   39.726  1
4   63.014  2.740   2.740   2.740   28.767  2
5   90.411  1.370   6.849   0.000   1.370  2
6   15.068  2.740   16.438  8.219   57.534  2
7   67.123  0.000   0.000   1.000   32.877  3
8   72.603  6.849   5.479   5.000   15.068  3
9   56.164  12.329  6.849   4.110   20.548  3
10  50.685  4.110   8.219   1.370   35.616  3
}\datatable

\begin{document}
\makeatletter
\begin{tikzpicture}
\begin{axis}[
    ylabel=label,
    xtick=data,
    xticklabels={S1,S2,S3,S4,S5,S6,S7,S8,S9,S10},
    enlarge y limits=false,
    enlarge x limits=0.1,
    ymin=0,ymax=100,
    ybar stacked,
    bar width=10pt,
    legend style={
      font=\footnotesize,
      cells={anchor=west},
      legend columns=5,
      at={(0.3,-0.20)},
      anchor=north,
      /tikz/every even column/.append style={column sep=0.2cm}
    },
     draw group line={[index]6}{1}{X Group}{-3.5ex}{7pt},
    draw group line={[index]6}{2}{Y Group}{-3.5ex}{7pt},
    draw group line={[index]6}{3}{Z Group}{-3.5ex}{7pt}
]

\addplot table[x index=0,y index=1] \datatable;
\addplot table[x index=0,y index=2] \datatable;
\addplot table[x index=0,y index=3] \datatable;
\legend{Far,Near,Here}
\end{axis}

\begin{axis}[
    ylabel=label,
    xtick=data,
    xticklabels={S1,S2,S3,S4,S5,S6,S7,S8,S9,S10},
    enlarge y limits=false,
    enlarge x limits=0.1,
    ymin=0,ymax=100,
    legend style={
      font=\footnotesize,
      cells={anchor=west},
      legend columns=5,
      at={(0.71,-0.20)},
      anchor=north,
      /tikz/every even column/.append style={column sep=0.2cm}
    },
     draw group line={[index]6}{1}{X Group}{-3.5ex}{7pt},
    draw group line={[index]6}{2}{Y Group}{-3.5ex}{7pt},
    draw group line={[index]6}{3}{Z Group}{-3.5ex}{7pt}
]

\addplot table[x index=0,y index=4] \datatable;
\legend{There}
\end{axis}
\end{tikzpicture}
\end{document}

enter image description here

Ronak
  • 73

1 Answers1

4

I initially thought this could be done with a single \addplot command with no modifications to the data table; apparently this is not the case (See How to interrupt a plot?).

However, you can splitting the plot in three and restrict domains using restrict x to domain, as suggested by alfC in his answer to the linked question:

\documentclass{article}
\usepackage{tikz}
\usepackage{pgfplots}

\makeatletter
\newcounter{groupcount}
\pgfplotsset{
    draw group line/.style n args={5}{
        after end axis/.append code={
            \setcounter{groupcount}{0}
            \pgfplotstableforeachcolumnelement{#1}\of\datatable\as\cell{%
                \def\temp{#2}
                \ifx\temp\cell
                    \ifnum\thegroupcount=0
                        \stepcounter{groupcount}
                        \pgfplotstablegetelem{\pgfplotstablerow}{[index]0}\of\datatable
                        \coordinate [yshift=#4] (startgroup) at (axis cs:\pgfplotsretval,0);
                    \else
                        \pgfplotstablegetelem{\pgfplotstablerow}{[index]0}\of\datatable
                        \coordinate [yshift=#4] (endgroup) at (axis cs:\pgfplotsretval,0);
                    \fi
                \else
                    \ifnum\thegroupcount=1
                        \setcounter{groupcount}{0}
                        \draw [
                            shorten >=-#5,
                            shorten <=-#5
                        ] (startgroup) -- node [anchor=north] {#3} (endgroup);
                    \fi
                \fi
            }
            \ifnum\thegroupcount=1
                        \setcounter{groupcount}{0}
                        \draw [
                            shorten >=-#5,
                            shorten <=-#5
                        ] (startgroup) -- node [anchor=north] {#3} (endgroup);
            \fi
        }
    }
}
\makeatother

\pgfplotstableread{
1   19.178  26.027  8.219   6.849   39.726  1
2   54.795  21.918  4.110   6.849   12.329  1
3   28.767  16.438  6.849   8.219   39.726  1
4   63.014  2.740   2.740   2.740   28.767  2
5   90.411  1.370   6.849   0.000   1.370  2
6   15.068  2.740   16.438  8.219   57.534  2
7   67.123  0.000   0.000   1.000   32.877  3
8   72.603  6.849   5.479   5.000   15.068  3
9   56.164  12.329  6.849   4.110   20.548  3
10  50.685  4.110   8.219   1.370   35.616  3
}\datatable

\begin{document}

\begin{tikzpicture}
\begin{axis}[
    ylabel=label,
    xtick=data,
    xticklabels={S1,S2,S3,S4,S5,S6,S7,S8,S9,S10},
    enlarge y limits=false,
    enlarge x limits=0.1,
    ymin=0,ymax=100,
    ybar stacked,
    bar width=10pt,
    legend style={
      font=\footnotesize,
      cells={anchor=west},
      legend columns=5,
      at={(0.3,-0.20)},
      anchor=north,
      /tikz/every even column/.append style={column sep=0.2cm}
    },
]
\addplot table[x index=0,y index=1] \datatable;
\addplot table[x index=0,y index=2] \datatable;
\addplot table[x index=0,y index=3] \datatable;
\legend{Far,Near,Here}
\end{axis}
\begin{axis}[
    ylabel=label,
    xtick=data,
    xticklabels={S1,S2,S3,S4,S5,S6,S7,S8,S9,S10},
    enlarge y limits=false,
    enlarge x limits=0.1,
    ymin=0,ymax=100,
    legend style={
      font=\footnotesize,
      cells={anchor=west},
      legend columns=5,
      at={(0.71,-0.20)},
      anchor=north,
      /tikz/every even column/.append style={column sep=0.2cm}
    },
    draw group line={[index]6}{1}{X Group}{-3.5ex}{7pt},
    draw group line={[index]6}{2}{Y Group}{-3.5ex}{7pt},
    draw group line={[index]6}{3}{Z Group}{-3.5ex}{7pt}
]

\addplot+[forget plot] table[x index=0,y index=4, restrict x to domain=0:3] \datatable;
\addplot+[forget plot] table[x index=0,y index=4, restrict x to domain=4:6] \datatable;
\addplot+ table[x index=0,y index=4, restrict x to domain=7:10] \datatable;
\legend{There}
\end{axis}
\end{tikzpicture}

\end{document}

enter image description here

Gonzalo Medina
  • 505,128
  • I have managed to add a line graph on the bar graph. But, the line graph is continuous from S1 to S10. How can I break the line graph? For example, no line between S3 and S4; S6 and S7.

    Thanks.

    – Ronak Mar 21 '14 at 13:31
  • @Ronak Sorry, but I'm confused. I don't know what you mean by "line graph"; I though you were referring to a straight line, but apparently this is not the case. Can you please explain what exactly are you trying to do? Also it would hel a lot of you edit your question and add there the code you are using to add the "line graph" you mentioned in your previous comment. – Gonzalo Medina Mar 21 '14 at 20:46
  • Sorry, I guess I uploaded the incomplete code before. I have updated the question now. Thanks. – Ronak Mar 23 '14 at 11:21
  • @Ronak No problem. Now I know what you meant. Please see my updated answer. – Gonzalo Medina Mar 23 '14 at 20:58
  • Thanks so much. It perfectly solves my problem :).

    The other technique suggested on your questions is also good as it'll reduce the number of lines of code. I'll try if that can fit into my full graph.

    – Ronak Mar 24 '14 at 04:39