I have the following code to graph a function with a height of 2em, and in line with some text, but it gives an error.
\documentclass{article}
\usepackage{pgfplots}
\newcommand\quadratic{
\begin{tikzpicture}
\begin{axis}[axis lines=none,height=2em]
\addplot[mark=none]{x^2};
\end{axis}
\end{tikzpicture}}
\begin{document}
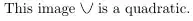
This image \quadratic is a quadratic.
\end{document}
Package pgfplots Error: Error: Plot width `23.1882pt' is too small.
This cannot be implemented while maintaining constant size for labels.
Sorry, label sizes are only approximate. You will need to adjust your width.
Which is kinda silly considering I've removed the labels. I want an output like so:

\scalebox{<scale>}{plot}. Hiding axis lines or emptying the ticks don't mean that you skip the whole plotting mechanism (though plausible alternative). – percusse Apr 06 '14 at 10:46