The following code I got from: https://tex.stackexchange.com/a/76014/10898
\documentclass{article}
\usepackage{pgfplots}
\usetikzlibrary{patterns}
\makeatletter
\newcommand{\pgfplotsdrawaxis}{\pgfplots@draw@axis}
\makeatother
\pgfplotsset{only axis on top/.style={axis on top=false, after end axis/.code={
\pgfplotsset{axis line style=opaque, ticklabel style=opaque, tick style=opaque,
grid=none}\pgfplotsdrawaxis}}}
\newcommand{\drawge}{-- (rel axis cs:1,0) -- (rel axis cs:1,1) -- (rel axis cs:0,1) \closedcycle}
\newcommand{\drawle}{-- (rel axis cs:1,1) -- (rel axis cs:1,0) -- (rel axis cs:0,0) \closedcycle}
\begin{document}
\begin{figure}[htpb]
\centering
\label{fig:p3:c1}
\begin{tikzpicture}
\begin{axis}[only axis on top,
axis line style=very thick,
axis x line=middle,
axis y line=middle,
ymin=-1,ymax=5.99,xmin=-1,xmax=5.99,
xlabel=$x$, ylabel=$y$,grid=major
]
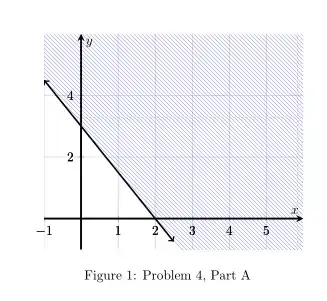
\addplot [draw=none, pattern=north west lines, pattern color=blue!40, domain=-10:12]
{3-3/2*x} \drawge;
\addplot[very thick, domain=-1:2.5,<->] {3-3/2*x};
\end{axis}
\end{tikzpicture}
\caption{Problem 4, Part A}
\end{figure}
\end{document}
The question here is how can I get it to work with a setting like the following:

\documentclass[dvipsnames]{article}
\usepackage{amsmath,pgfplots,tikz}
\usetikzlibrary{arrows,calc}
\begin{document}

    \begin{tikzpicture}[transform shape,scale=0.6]
    \draw[step=1cm,gray,very thin] (-4,-3) grid (4,5);
    \draw [-latex,thick](-4,0) -- (4,0) node[right] {$x$} coordinate(x axis);
    \foreach \x in {-3,-2,-1,1,2,3}
             \draw (\x,0.1) -- (\x,-0.1) node [fill=white,below] {$\x$};
    \foreach \y in {-2,-1,1,2,3,4}
             \draw (0.1,\y) -- (-0.1,\y) node [fill=white,left] {$\y$};
    \draw [-latex,thick](0,-3) -- (0,5) node[above] {$y$} coordinate(y axis);
    \node at (-0.25,-0.3375) {0};
    \draw[color=Cerulean,latex-latex,domain=-1.3:4] plot (\x,-3/2*\x+3);
    \filldraw[OrangeRed] (0,3) circle (1.5pt) node[inner sep=2pt,right,fill=white,shift={(0.25,0)}] {$(0,3)$};
    \filldraw[OrangeRed] (2,0) circle (1.5pt) node[inner sep=2pt,right,fill=white,shift={(0.25,0.35)}] {$(2,0)$};
    \end{tikzpicture}
\end{document}
That is, I would like to represent the solution set of the inequality in a similar manner as is done using pgfplots in my last example above. Is this possible?

