I am trying to replicate the following image:

My work so far:
\documentclass{article}
%%for graphs
\usepackage{tikz}
\usetikzlibrary{calc}
\usepackage{pgfplots}
\pgfplotsset{compat=1.10}
\usepgfplotslibrary{fillbetween}
%%end graph code
\begin{document}
\begin{tikzpicture}[scale=1]
\begin{axis}[
        axis x line=bottom,%need to change to bottom to put 0 in
        axis y line=middle,
        x label style={at={(axis cs: 2.6, -0.12)},anchor=south},%rotate = degrees number can be used to rotate the label
        y label style={at={(axis cs:0, 2.5)},anchor=south},
        xtick={0, 1, 2}, %or {listofvalues, , },
        ytick={0, 1, 2},
        yticklabels={$0$, $1$, $2$},
        xticklabels={$0$, $1$, $2$},
        ymin=0,
        ymax=2.5,
        xmin=0,
        xmax=2.5,
        ylabel=$y$,
        xlabel=$x$,
        area style,
        ]
    %thick lines
    \draw[draw = black, ultra thick] (axis cs: 0, 0) -- (axis cs: 0, 2);
    \draw[draw = black, ultra thick] (axis cs: 0.5, 0) -- (axis cs: 0.5, 1.5) node [above, right] {$y = 2 - x$};
    %y=0 label
    \node [below] at (axis cs: 0.5,0) {$y=0$};
    %line with label
    \addplot+[draw = black, ultra thick, name path = upper, domain=0:2] {2-x} node [midway, sloped, above, black] {$x + y = 2$};
    %node for labeling line
    \addplot+[draw = black, ultra thick, name path = lower, domain=0:2] {0};

    %shading

    \addplot[gray!40] fill between[of = upper and lower];
\end{axis}
\end{tikzpicture}
\end{document}
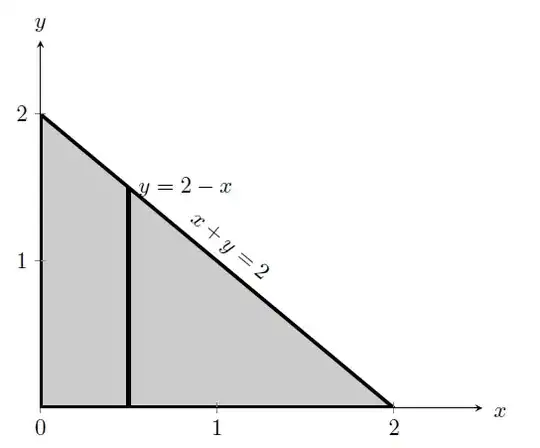
The main issues are that the node labels aren't appearing and and positioned correctly, and I'm not sure how to get the circular ends of lines.
Thanks for any help - sorry if these questions have already been answered elsewhere.


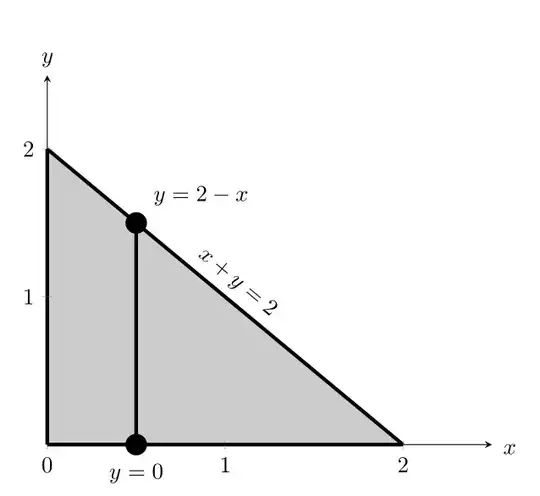
usetikzlibrary{arrows}in your preamble you could then use\draw[-*] (0,0) -- (1,1);– s__C Jun 14 '14 at 16:18