2

Based on the code provided by Jake:

\draw[very thin] (axis cs:\pgfkeysvalueof{/pgfplots/xmin},0) -- (axis cs:\pgfkeysvalueof{/pgfplots/xmax},0);

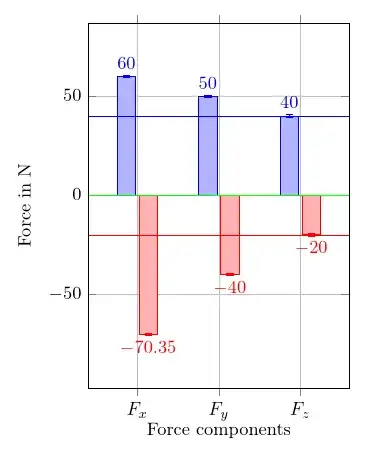
I am drawing a zero line for y-values for bar plots. Yet it does not work if one uses symbolic x coords=....

One could write \draw[very thin] (axis cs:Fx,0) -- (axis cs:Fz,0);, but this does not suffice. Using Fx.west or Fx.left does not work.

MWE

\documentclass[
a4paper
]{scrartcl}

\usepackage{
amsmath,
tikz,
pgfplots,
pgfplotstable
}

\usepackage{lmodern}
\usepackage[T1]{fontenc}
\usepackage[utf8]{inputenc}

\begin{filecontents}{force-stats.txt}
Stats,Min,MinStdDev,MinCIP95,Max,MaxStdDev,MaxCIP95
Fx,-70.35,0.5,0.6,60,1,0.5
Fy,-40,0.5,0.6,50,1.91,1.5
Fz,-20,0.42,0.6,40,4,0.5
\end{filecontents}

\pgfplotstableread[col sep=comma]{force-stats.txt}{\tableabcdef}

\begin{document}
\begin{center}
\begin{tikzpicture}[font=\small]
\begin{axis}[
scale only axis=true,
width=5cm,
height=7cm,
%
xlabel={Force components},
ylabel={Force in N},
%
ybar,
%
xmajorgrids=true,
ymajorgrids=true,
%
enlarge x limits={0.3},
enlarge y limits={0.2},
%
symbolic x coords={Fx,Fy,Fz},
%
xtick=data,
nodes near coords,
xticklabels={{\(F_{x}\)},{\(F_{y}\)},{\(F_{z}\)}},
]
%the following line will not work
%\draw[very thin] (axis cs:\pgfkeysvalueof{/pgfplots/xmin},0) -- (axis cs:\pgfkeysvalueof{/pgfplots/xmax},0);
\addplot+[nodes near coords align={above}] plot [error bars/.cd, y dir=both, y explicit] table [col sep=comma, x=Stats, y=Max, y error=MinCIP95] {\tableabcdef};
\addplot+[nodes near coords align={below}] plot [error bars/.cd, y dir=both, y explicit] table [col sep=comma, x=Stats, y=Min, y error=MinCIP95] {\tableabcdef};
\end{axis}
\end{tikzpicture}
\end{center}
\end{document}
henry
  • 6,594
  • It seems that @percusse's second suggestion with rel axis cs can work in this case (at least in this specific case where "y=0" can easily be translated to "0.5" in relative coordinates). – T. Verron Jul 18 '14 at 08:35
  • @T.Verron Hm, interesting, that would make sense but it does not produce a line at all for me. – henry Jul 18 '14 at 08:40
  • \draw[very thin,red] ({rel axis cs:0,0} |- {axis cs:Fx,0}) -- ({axis cs:Fz,0} -| {rel axis cs:1,0}); that works for me (the zeros specifying the y coordinate of your line being the ones in Fx,0 and Fz,0). – T. Verron Jul 18 '14 at 08:53

2 Answers2

4

You can use

after end axis/.append code={
  \draw[very thick] (current axis.left of origin) -- (current axis.right of origin);
}

enter image description here

Code:

\documentclass{scrartcl}

\usepackage{
amsmath,
pgfplots,
pgfplotstable
}

\usepackage{lmodern}
\usepackage[T1]{fontenc}
\usepackage[utf8]{inputenc}

\begin{filecontents}{force-stats.txt}
Stats,Min,MinStdDev,MinCIP95,Max,MaxStdDev,MaxCIP95
Fx,-70.35,0.5,0.6,60,1,0.5
Fy,-40,0.5,0.6,50,1.91,1.5
Fz,-20,0.42,0.6,40,4,0.5
\end{filecontents}

\pgfplotstableread[col sep=comma]{force-stats.txt}{\tableabcdef}

\begin{document}
\begin{center}
\begin{tikzpicture}[font=\small]
\begin{axis}[
scale only axis=true,
width=5cm,
height=7cm,
%
xlabel={Force components},
ylabel={Force in N},
%
ybar,
%
xmajorgrids=true,
ymajorgrids=true,
%
enlarge x limits={0.3},
enlarge y limits={0.2},
%
symbolic x coords={Fx,Fy,Fz},
%
xtick=data,
nodes near coords,
xticklabels={{\(F_{x}\)},{\(F_{y}\)},{\(F_{z}\)}},
after end axis/.append code={
  \draw[very thick] (current axis.left of origin) -- (current axis.right of origin);
}
]
\addplot+[nodes near coords align={above}] plot [error bars/.cd, y dir=both, y explicit] table [col sep=comma, x=Stats, y=Max, y error=MinCIP95] {\tableabcdef};
\addplot+[nodes near coords align={below}] plot [error bars/.cd, y dir=both, y explicit] table [col sep=comma, x=Stats, y=Min, y error=MinCIP95] {\tableabcdef};
\end{axis}
\end{tikzpicture}
\end{center}
\end{document}
esdd
  • 85,675
2

Based on the second suggestion from percusse's answer to the linked question, you can use relative axis coordinates for cases like that.

For example, this code will produce a red horizontal line at y=20:

\draw[very thin,red] 
       ({rel axis cs:0,0} |- {axis cs:Fx,-20}) 
    -- ({axis cs:Fz,-20} -| {rel axis cs:1,0});

And you will probably want to make it a macro, since it requires inputting the wanted y coordinate twice.

enter image description here

\documentclass[
a4paper
]{scrartcl}

\usepackage{
  amsmath,
  tikz,
  pgfplots,
  pgfplotstable
}

\usetikzlibrary{calc}

\usepackage{lmodern}
\usepackage[T1]{fontenc}
\usepackage[utf8]{inputenc}

\begin{filecontents}{force-stats.txt}
  Stats,Min,MinStdDev,MinCIP95,Max,MaxStdDev,MaxCIP95
  Fx,-70.35,0.5,0.6,60,1,0.5
  Fy,-40,0.5,0.6,50,1.91,1.5
  Fz,-20,0.42,0.6,40,4,0.5
\end{filecontents}

\pgfplotstableread[col sep=comma]{force-stats.txt}{\tableabcdef}

\begin{document}
\begin{center}
  \begin{tikzpicture}[font=\small]
    \begin{axis}[
      scale only axis=true,
      width=5cm,
      height=7cm,
      %
      xlabel={Force components},
      ylabel={Force in N},
      %
      ybar,
      %
      xmajorgrids=true,
      ymajorgrids=true,
      %
      enlarge x limits={0.3},
      enlarge y limits={0.2},
      %
      symbolic x coords={Fx,Fy,Fz},
      %
      xtick=data,
      nodes near coords,
      xticklabels={{\(F_{x}\)},{\(F_{y}\)},{\(F_{z}\)}},
      ]
      %the following line will not work
      %\draw[very thin] (axis cs:\pgfkeysvalueof{/pgfplots/xmin},0) -- (axis cs:\pgfkeysvalueof{/pgfplots/xmax},0);
      \addplot+[nodes near coords align={above}] plot [error bars/.cd, y dir=both, y explicit] table [col sep=comma, x=Stats, y=Max, y error=MinCIP95] {\tableabcdef};
      \addplot+[nodes near coords align={below}] plot [error bars/.cd,
      y dir=both, y explicit] table [col sep=comma, x=Stats, y=Min, y
      error=MinCIP95] {\tableabcdef};
      %% NEW
      \draw[very thin,green] ({rel axis cs:0,0} |- {axis cs:Fx,0}) --
      ({axis cs:Fz,0} -| {rel axis cs:1,0});
      \draw[very thin,blue] ({rel axis cs:0,0} |- {axis cs:Fx,40}) --
      ({axis cs:Fz,40} -| {rel axis cs:1,0});
      \draw[very thin,red] ({rel axis cs:0,0} |- {axis cs:Fx,-20}) --
      ({axis cs:Fz,-20} -| {rel axis cs:1,0});
      %% END NEW
    \end{axis}
  \end{tikzpicture}
\end{center}
\end{document}
T. Verron
  • 13,552