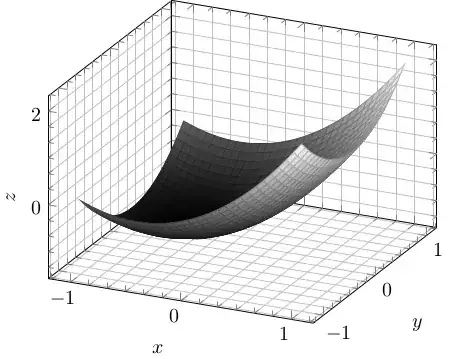
I my previous question, I rendered a 3d plot, but as I want to print my plots they should be in black, white or gray coloring format. How should I change the coloring scheme?
\documentclass{standalone}
\usepackage{pgfplots}
\pgfplotsset{compat=1.9}

\begin{document}
\begin{tikzpicture}
    \directlua{
        q = function(x)
            return x-1
        end
            Z = function(x,y)
            return x^2+y^2+q(x)
        end
    }
    \pgfmathdeclarefunction{Z}{2}{%
        \edef\pgfmathresult{\directlua{tex.print(Z(\pgfmathfloatvalueof{#1},\pgfmathfloatvalueof{#2}))}}%
    }%
    \begin{axis}
    [
    grid=both,minor tick num=1,
    xlabel=$x$,ylabel=$y$,zlabel=$z$,
    enlargelimits,
    tick align=inside,
    domain=-1:1,
    samples=30,
    minor tick num=5,
    ]
    \addplot3 [surf] {Z(x,y)};
    \end{axis}
\end{tikzpicture}
\end{document}