I want it to look like this:

Preferably with comments so I can learn how to make my own!
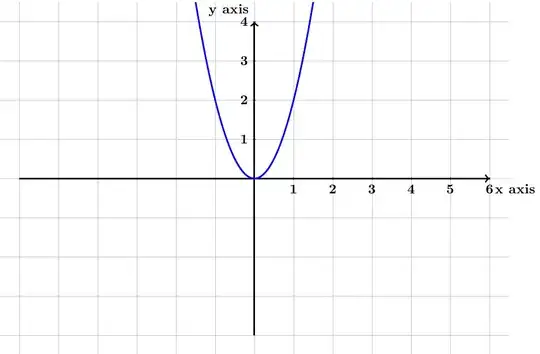
I want it to look like this:
Preferably with comments so I can learn how to make my own!
This should get you started:
\documentclass{article}
\usepackage{pgfplots}
\pgfplotsset{compat=1.11}

\begin{document}

\begin{tikzpicture}
\begin{axis}[
  axis lines=middle,
  grid=major,
  xmin=-5,
  xmax=5,
  ymin=-3,
  ymax=5,
  xlabel=$x$,
  ylabel=$y$,
  xtick={-4,-3,...,4},
  ytick={-2,-1,...,4},
  tick style={very thick},
  legend style={
  at={(rel axis cs:0,1)},
  anchor=north west,draw=none,inner sep=0pt,fill=gray!10}
]
\addplot[blue,thick,samples=100] {x^2};
\addlegendentry{$y=x^2$}
\end{axis}
\end{tikzpicture}

\end{document}

The code itself is self explanatory IMO. For details, run texdoc pgfplots from command prompt/terminal and look in to the pgfplots manual.
Just to make you started.
\documentclass{standalone}

\usepackage{tikz}

\begin{document}
 \begin{tikzpicture}
 %grid
  \draw[step=1cm,gray!50,very thin] (-6.5,-4.5) grid (6.5,4.5);
  %axes
  \draw[very thick,->] (-6,0) -- (6,0) node[anchor=north west] {\bf{x axis}};
  \draw[very thick,->] (0,-4) -- (0,4) node[anchor=south east] {\bf{y axis}};
  \foreach \x in {1,2,3,4,5,6}
    \draw (\x cm,1pt) -- (\x cm,-1pt) node[anchor=north] {$\mathbf{\x}$};
  \foreach \y in {1,2,3,4}
    \draw (1pt,\y cm) -- (-1pt,\y cm) node[anchor=east] {$\mathbf{\y}$};
   %function
   \draw[scale=0.5,domain=-3:3,smooth,variable=\x,blue,very thick] plot ({\x},{\x*\x});
 \end{tikzpicture}
\end{document}