I would like to plot a rotated curve (gaussian) but I've got no idea how. I searched in the internet and found that I have to define the gaussian curve because it's not included. But how can I plot such a function rotated by 270°?
Thanks!
I would like to plot a rotated curve (gaussian) but I've got no idea how. I searched in the internet and found that I have to define the gaussian curve because it's not included. But how can I plot such a function rotated by 270°?
Thanks!
You could plot your Gaussian curve with 1/sqrt(2pi)e^{-x^2/2} in PGFPlots. Then you could use the standalone package to include the figure and use the options to rotate the image.
\begin{figure}
\includestandalone[mode = image]{myplot}
\end{figure}
Here is a post on 4 different ways to rotate a figure: Rotate picture with caption
Or you could simply rotate the PGFPlots with option rotate around = 270 and then insert standalone figure.
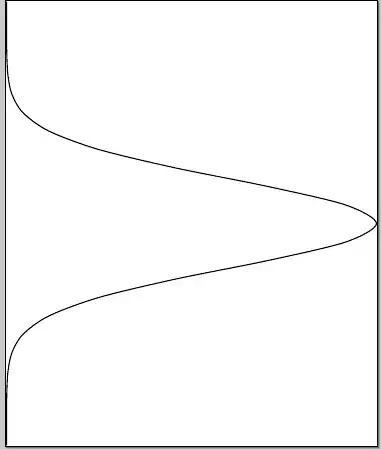
How to make the plot rotated:
\documentclass[tikz]{standalone}
\usepackage{pgfplots}
\pgfplotsset{compat = newest}
\begin{document}
\begin{tikzpicture}
\begin{axis}[
anchor = origin,
rotate around={270:(current axis.origin)},
hide axis
]
\addplot[smooth, domain=-5:5] {1/sqrt(2*pi)*exp(-\x^2/2)};
\end{axis}
\end{tikzpicture}
\end{document}