4

I have data from an experiment composed of three treatments, A, B, C. I watn to show in a compact way in a table the result of statistical tests (say, t-test) f A/B, A/C, and B/C. This is an example empty table.

\begin{center}
\begin{tabular}{lccc}
                   &  Control   & Treatment1 & Treatment2 \\
\textbf{Measure 1} &     24     &    28      &    13      \\
\textbf{Measure 2} &     12     &    13      &    21
\end{tabular}
\end{center}

I would like to display the stars indicating difference between A and B graphically, let's say with an arrow between A and B; same for B and C; but for A/C I need a longer sort of arrow, that passes 'over' B.

Here a graphical example of what I would like to obtain.

showing statistical differences for three treatments

Is there a way to obtain this in pure latex (no tiKz)? Or are there out there other ideas on how to convey the meaning of statistical tests across >2 treatments?

Thanks!

3 Answers3

2

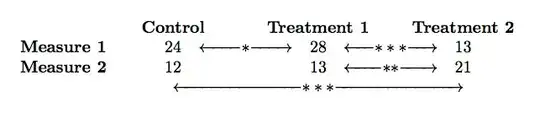
Here is a solution using \tikzmark:

enter image description here

If using booktabs one needs to leave some additional space for the \bottomrule:

enter image description here

Code:

\documentclass{article}
\usepackage{tikz}
\usetikzlibrary{calc}

\tikzset{AST style/.style={fill=white}}
\newcommand{\tikzmark}[2]{\tikz[overlay,remember picture,anchor=base] \node (#1) {#2};}
\newcommand{\ThreeAst}{${\ast}{\ast}{\ast}$}

\begin{document}
{\centering%
\begin{tabular}{lccc}
                   &  Control   & Treatment1 & Treatment2 \\
\textbf{Measure 1} &     \tikzmark{M1 Control}{24}     &  \tikzmark{M1 Treat1}{28}      &    \tikzmark{M1 Treat2}{13}      \\
\textbf{Measure 2} &     \tikzmark{M2 Control}{12}     &    \tikzmark{M2 Treat1}{13}      &    \tikzmark{M2 Treat2}{21}
\end{tabular}\par}
\begin{tikzpicture}[overlay,remember picture,blue, thick]%
    \draw [stealth-stealth] (M1 Control) -- (M1 Treat1) node[pos=0.5, AST style] {$\ast$};
    \draw [stealth-stealth] (M1 Treat1)  -- (M1 Treat2) node[pos=0.5, AST style] {\ThreeAst};
    \draw [stealth-stealth] (M2 Treat1)  -- (M2 Treat2) node[pos=0.5, AST style] {\ThreeAst};
    \coordinate (M2 Control Extended) at ($(M2 Control.south)+(0pt,-0.75ex)$);
    \coordinate (M2 Treat2 Extended)  at ($(M2 Treat2.south) +(0pt,-0.75ex)$);
    \draw (M2 Control.south) -- (M2 Control Extended) 
        -- (M2 Treat2 Extended) -- (M2 Treat2.south);
    \node [below, AST style] at ($(M2 Treat1)+(0pt,-0.75ex)$) {\ThreeAst};
\end{tikzpicture}
\end{document}

Code: booktabs:

\documentclass{article}
\usepackage{tikz}
\usetikzlibrary{calc}
\usepackage{booktabs}

\tikzset{AST style/.style={fill=white, text=red, outer sep=0pt}}
\newcommand{\tikzmark}[2]{\tikz[overlay,remember picture,anchor=base] \node (#1) {#2};}
\newcommand{\ThreeAst}{${\ast}{\ast}{\ast}$}

\begin{document}
{\centering%
\begin{tabular}{lccc}\toprule
                   &  \textbf{Control}   & \textbf{Treatment1} & \textbf{Treatment2} \\
                   \cmidrule(lr){2-2}
                   \cmidrule(lr){3-3}
                   \cmidrule(lr){4-4}
\textbf{Measure 1} &     \tikzmark{M1 Control}{24}     &  \tikzmark{M1 Treat1}{28}      &    \tikzmark{M1 Treat2}{13}      \\
\textbf{Measure 2} &     \tikzmark{M2 Control}{12}     &    \tikzmark{M2 Treat1}{13}      &    \tikzmark{M2 Treat2}{21} \\[1.5ex]
\bottomrule
\end{tabular}\par}
\begin{tikzpicture}[overlay,remember picture,blue, thick]%
    \draw [stealth-stealth] (M1 Control) -- (M1 Treat1) node[pos=0.5, AST style] {$\ast$};
    \draw [stealth-stealth] (M1 Treat1)  -- (M1 Treat2) node[pos=0.5, AST style] {\ThreeAst};
    \draw [stealth-stealth] (M2 Treat1)  -- (M2 Treat2) node[pos=0.5, AST style] {\ThreeAst};
    \coordinate (M2 Control Extended) at ($(M2 Control.south)+(0pt,-0.75ex)$);
    \coordinate (M2 Treat2 Extended)  at ($(M2 Treat2.south) +(0pt,-0.75ex)$);
    \draw (M2 Control.south) -- (M2 Control Extended) 
        -- (M2 Treat2 Extended) -- (M2 Treat2.south);
    \node [below, AST style] at ($(M2 Treat1)+(0pt,-0.75ex)$) {\ThreeAst};
\end{tikzpicture}
\end{document}
Peter Grill
  • 223,288
  • Definitely good answer - aesthetically pleasing and very nice. I like it but I will approve the no-extra-packages answer, as it looks simpler and does not require extra packages... thans for answering and for a complete code example – PaoloCrosetto Nov 03 '14 at 09:20
1

This is an attempt via xy-pic and tiz-cd because they have table-like structures that can meet the demands.

enter image description here

Code

\documentclass{article}
\usepackage[margin=1in]{geometry}
\usepackage[all,cmtip]{xy}
\usepackage{tikz-cd}
\usepackage{amsmath}% http://ctan.org/pkg/stackrel
\begin{document}
\xymatrix@=2pt{
& \textbf{Control} &      &\textbf{Treatment1}  &      &\textbf{Treatment2} \\ 
\textbf{Measure 1} & 24   & \ar[l] \star \ar[r] & 28   &\ar[l] \star\star\star\ar[r]  &   13 \\ 
\textbf{Measure 2} &  12  &  & 13   &   \ar[l] \star\star\star \ar[r]  &  21  \\ 
   &    &       & \ar[ll]\star\star\star \ar[rr]  &                    &  \\           
}
\vspace{2cm}   

\begin{tikzcd}[column sep=25pt, row sep=2pt]\hline
 & \textbf{Control} &      &\textbf{Treatment1}&   &\textbf{Treatment2} \\\hline
\textbf{Measure 1}  &  24  & \ar[l] * \ar[r]   & 28 & \ar[l] *** \ar[r] & 13 \\\hline 
\textbf{Measure 2}  &  12  &                   &  
\ar[ll,shorten >=-0.3cm,yshift=-5pt]\underset{***}{13}\ar[rr,shorten >=-0.3cm,yshift=-5pt]   
& \ar[l] *** \ar[r]  &  21 \\ [-5pt]\hline
\end{tikzcd}
\end{document}
Jesse
  • 29,686
1

Here's a non-TikZ approach. In fact it requires no extra packages at all.

enter image description here

\documentclass{article}
% a fill with arrows to given size, but hide width
\newcommand\doublearrowfill[2]{\makebox[0.7em][c]{\makebox[#2][c]{\leftarrowfill{#1}\rightarrowfill}}}
% commands for the significance arrows
\newcommand\sig  {\doublearrowfill{$\ast$}{2cm}}
\newcommand\sigg {\doublearrowfill{$\ast\ast$}{2cm}}
\newcommand\siggg{\doublearrowfill{$\ast\ast\ast$}{2cm}}
\newcommand\Sig  {\doublearrowfill{$\ast$}{62mm}}
\newcommand\Sigg {\doublearrowfill{$\ast\ast$}{62mm}}
\newcommand\Siggg{\doublearrowfill{$\ast\ast\ast$}{62mm}}
% make headings same size and set in bold face
\newcommand\tabhead[1]{\makebox[2cm][c]{\textbf{#1}}}
\begin{document}
\begin{tabular}{lccccc}
    &\tabhead{Control}&&\tabhead{Treatment 1}&&\tabhead{Treatment 2}\\
    \textbf{Measure 1} & 24 & \sig & 28 & \siggg & 13\\
    \textbf{Measure 2} & 12 &      & 13 & \sigg  & 21\\
    &&&\Siggg
\end{tabular}
\end{document}

With a little more work, the arrowheads on the long arrow could be made into up-ticks.

Thruston
  • 42,268
  • Thanks @Thruston. It looks a bit like a hack, but it definitely works and is simple & fast. How about changing the arrows into up-ticks? Can you provide some info about that? I'll look into it in the meantime too – PaoloCrosetto Nov 03 '14 at 09:17
  • @PaoloCrosetto define a leftuptickfill command along the lines of leftarrowfill in Plain TeX but using a small vertical line instead of a left arrow. And vice versa for the right side. The fiddly bit is getting the spacing and the leaders just right so that everything joins up neatly. – Thruston Nov 03 '14 at 09:55