Using the data in this file, I have the following plot:
\documentclass{article}
\usepackage{tikz}
\usepackage{pgfplots}
\usepackage{savetrees}

\begin{document}

\begin{figure}[b]
    \centering
    \begin{tikzpicture}
        \begin{axis}[
            width=\linewidth,
            height=0.9\textheight,
            view = {95}{40},
            zmin = 0,
            restrict z to domain = 1:,
            axis x line = left,
            axis y line = left,
            axis z line = right,
        ]
            \addplot3 [draw=black, mark=none] table {biomass.txt};
        \end{axis}
    \end{tikzpicture}
    \caption{Caption}
\end{figure}

\end{document}
giving
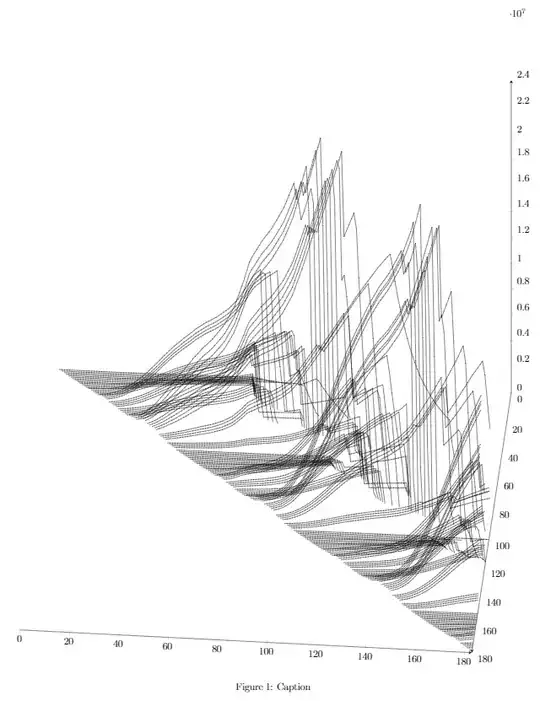
I would like to trim off the extra whitespace at the top, like so:

My guess is that the graph adds extra space at the top in case I want z axes all around, but the extra space shows up even though I don't need the top-left one.
Any help is appreciated.
Thanks for the suggestion of
– soapygopher Dec 12 '14 at 12:31\clip, it seems to work pretty well. It looks like\clip (-0.5, -1) rectangle (15, 19)are the best parameters for me.\clipsolves this specific question. – soapygopher Dec 12 '14 at 12:51