I am trying to draw two figures (three, in fact, but even two is not working) side by side using TikZ. I added two TikZ drawings in matrix.tex using \newcommand and tried to add them in the main file. But it is not working. (I got this idea from Placing TikZ drawings in a minipage side by side)
\documentclass[twoside,11pt]{article}
\usepackage{amsmath}
\usepackage{algorithm}
\usepackage{algorithmicx}
\usepackage{algpseudocode}
\usepackage{tikz}
\usetikzlibrary{positioning}
\usepackage{caption}
\usepackage{subcaption}

\begin{document}
\input{matrix.tex}
\begin{figure}[t]
\captionsetup[subfigure]{font=footnotesize}
\centering

\subcaptionbox{Confution Matrix}[.4\textwidth]{
\begin{tikzpicture}[box/.style={draw,rectangle,text width=1.5cm,align=left}]
\confmatrix
\end{tikzpicture} }

\subcaptionbox{Cost Matrix}[.3\textwidth] {
\begin{tikzpicture}[box/.style={draw,rectangle,minimum size =1cm,text width=1.5cm,align=left}]
\costmatrix
\end{tikzpicture} }

\end{figure}
\end{document}
matrix.tex
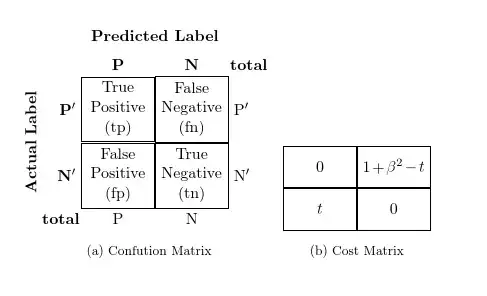
\newcommand{\confmatrix}{
\matrix (conmat) [row sep=.01cm,column sep=.01cm, ampersand replacement = \&]    {
\node (tpos) [box, align = center,
label=left:\( \mathbf{P'} \),
label=above:\( \mathbf{P} \)
] {True \\ Positive \\ (tp)};
\&
\node (fneg) [box, align = center,
label=above:\textbf{N},
label=above right:\textbf{total},
label=right:\( \mathrm{P}' \)] {False \\ Negative \\ (fn)};
\\
\node (fpos) [box, align = center,
label=left:\( \mathbf{N'} \),
label=below left:\textbf{total},
label=below:P] {False \\ Positive \\ (fp)};
\&
\node (tneg) [box, align = center,
label=right:\( \mathrm{N}' \),
label=below:N] {True \\ Negative \\ (tn)};
\\
};
\node [rotate=90,left=.01cm of conmat, text  width=2.5cm,align=center,anchor=center] {\textbf{Actual Label}};
\node [above=.05cm of conmat] {\textbf{Predicted Label}};
}

\newcommand{\costmatrix}{
\matrix (costmat) [row sep=.01cm,column sep=.01cm, ampersand replacement = \&] {
\node (tpcos) [box, align = center] {$0$};
\&
\node (fncos) [box, align = center] {$1+\beta^2-t$};
\\
\node (fpcos) [box, align = center] {$t$};
\&
\node (tncos) [box, align = center] {$0$};
\\
};
}
xfunctionspackage from? I don't find it using Google... – cryingshadow Dec 28 '14 at 09:52\input{./matrix.tex}? – Pier Paolo Dec 28 '14 at 10:45;at the end of your\newcommands definition. – Pier Paolo Dec 28 '14 at 10:55xfunctionspackage out (and if that it intended, you should remove it from the MWE), I get the following error: ! Undefined control sequence. l.19 \abx@aux@sortscheme {nyt} – cryingshadow Dec 28 '14 at 11:04\input{matrix.tex}command, instead I put the definitions directly in the master.texfile. If this doesn't work, too, please post the error you get when you compile your document. – Pier Paolo Dec 28 '14 at 11:08\subcaptionboxes (you may also have to add horizontal space (\hspace{2em}) to prevent figures from overlapping.) – Pier Paolo Dec 28 '14 at 11:23