0

I need to create a diagram of a neural network. I found this example online: http://www.texample.net/tikz/examples/neural-network/

However this examples shows how to create a graph from left to right. My goal is to create the graph from bottom up. So I want to show the visible layer on the bottom, then up the hidden layer. How can I achieve that?

Edit:

I'm trying to replicate this exact figure:

what-I-want

  • Change the coordinates the nodes are placed at, like this: \node[input neuron, pin=270:Input \#\y] (I-\name) at (\y,0) {}; (at the beginning of tikzpicture). For more complex refinements, first have a look at the TikZ-PGF Manual. – Pier Paolo Jan 10 '15 at 13:59
  • Or grow=up for graphdrawing. – Symbol 1 Jan 10 '15 at 14:06
  • 4
    Editing your question to ask for something else is incredibly frustrating for those who have taken the time to answer. Can you show us what you tried in order to adapt the existing code into what you want? – Paul Gessler Jan 10 '15 at 22:33

2 Answers2

9

Update: The OP asked a second question. This solution modifies the first solution and removed some redundancy, hoping this time it compiles.

enter image description here

Code

\documentclass{article}

\usepackage{tikz}
\usetikzlibrary{calc}

\begin{document}
\pagestyle{empty}

\def\layersep{2.5cm}

\tikzset{neuron/.style={circle,thick,fill=black!25,minimum size=17pt,inner sep=0pt},
    input neuron/.style={neuron, draw,thick, fill=gray!30},
    hidden neuron/.style={neuron,fill=white,draw},
    hoz/.style={rotate=-90}}   %<--- for labels

\begin{tikzpicture}[-,draw=black, node distance=\layersep,transform shape,rotate=90]  %<-- rotate the NN

% Draw the input layer nodes
\foreach \name / \y in {1/1,2/2,3/3,5/m}
\node[input neuron, hoz] (I-\name) at (0,-\name) {\color{red}$b_\y$};

\node[hoz] (I-4) at (0,-4) {$\dots$};

\foreach \name / \y in {1/1,2/2,3/3,5/m}
\path[hoz] (I-\name) node[below=0.5cm](0,-\name) {$v_\y$};

% Draw the hidden layer nodes
\foreach \name / \y in {1/1,2/2,3/3,6/n}
\path[yshift=0.5cm] node [hidden neuron, hoz] (H-\name) at (\layersep,-\name cm) {\color{red}$c_\y$};

\path[yshift=0.5cm]
   node[hoz] () at (\layersep,-4 cm) {$\dots$};
\path[yshift=0.5cm]
   node[hoz] () at (\layersep,-5 cm) {$\dots$};

\foreach \name / \y in {1/1,2/2,3/3,6/n}
\path[hoz] (H-\name) node[above=0.5cm]  {$h_\y$};  

\path node[hoz,right] at ($(I-5)!0.5!(H-6)$) {\color{red}$w_{nm}$};       

% Connect every node in the input layer with every node in the  hidden layer.
    \foreach \source in {1,2,3,5}
        \foreach \dest in {1,2,3,6}
            \path (I-\source.north) edge (H-\dest.south);
\end{tikzpicture}
% End of code
\end{document}

-------------------------- first edition

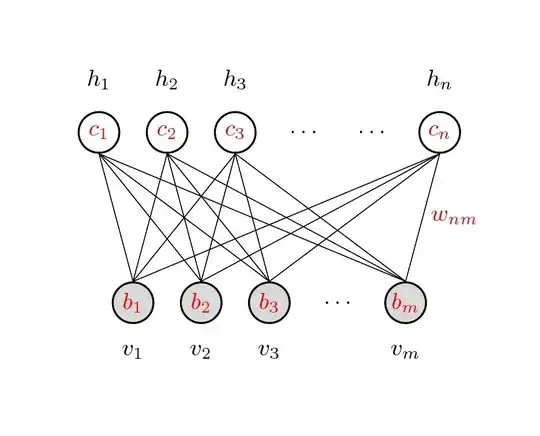
This is one possibility, draw as usual, then rotate the tikzpicture with tansform shape option and label respectively after completed, as shown below,

enter image description here

Code

\documentclass{article}

\usepackage{tikz}
\begin{document}
\pagestyle{empty}

\def\layersep{2.5cm}

\begin{tikzpicture}[shorten >=1pt,->,draw=black!50, node distance=\layersep,transform shape,rotate=90]  %<-- rotate the NN
    \tikzstyle{every pin edge}=[<-,shorten <=1pt]
    \tikzstyle{neuron}=[circle,fill=black!25,minimum size=17pt,inner sep=0pt]
    \tikzstyle{input neuron}=[neuron, fill=green!50];
    \tikzstyle{output neuron}=[neuron, fill=red!50];
    \tikzstyle{hidden neuron}=[neuron, fill=blue!50];
    \tikzstyle{annot} = [text width=4em, text centered]
    \tikzset{hoz/.style={rotate=-90}}   %<--- for labels
    % Draw the input layer nodes
    \foreach \name / \y in {1,...,4}
    % This is the same as writing \foreach \name / \y in {1/1,2/2,3/3,4/4}
        \node[input neuron, pin=left:\rotatebox{-90}{\parbox[t][][r]{8mm}{\centering Input \\\#\y}}] (I-\name) at (0,-\y) {};

    % Draw the hidden layer nodes
    \foreach \name / \y in {1,...,5}
        \path[yshift=0.5cm]
            node[hidden neuron] (H-\name) at (\layersep,-\y cm) {};

    % Draw the output layer node
    \node[output neuron,pin={[pin edge={->}]right:\rotatebox{-90}{Output}}, right of=H-3] (O) {};

    % Connect every node in the input layer with every node in the
    % hidden layer.
    \foreach \source in {1,...,4}
        \foreach \dest in {1,...,5}
            \path (I-\source) edge (H-\dest);

    % Connect every node in the hidden layer with the output layer
    \foreach \source in {1,...,5}
        \path (H-\source) edge (O);

    % Annotate the layers
    \node[annot,above of=H-1, node distance=1cm,hoz] (hl) {Hidden layer};
    \node[annot,left of=hl,hoz] {Input layer};
    \node[annot,right of=hl,hoz] {Output layer};
\end{tikzpicture}
% End of code
\end{document}
Jesse
  • 29,686
  • I'm sorry the code didn't compile :( it started to show errors at the line after % Draw the hidden layer nodes – Jack Twain Jan 10 '15 at 21:26
  • However I tried the code here http://tex.stackexchange.com/questions/132444/diagram-of-an-artificial-neural-network and it compiled. Not sure if I need to include some packages other than \usepackage{tikz}. – Jack Twain Jan 10 '15 at 21:27
  • Can you please see my edit and change your answer toward that figure? – Jack Twain Jan 10 '15 at 21:27
  • 4
    @JackTwain Can you edit your question to show how you've tried to use the ideas in this answer to draw the diagram you want to create? Maybe you are not aware that draw-it-for-me questions are not reasonable ones to ask on this site. Jesse has tried to demonstrate a general technique which you (and others) can apply. If you have problems when you try to use it, obviously that is a good reason to ask for additional help. But you've not shown how you are trying to use it yet. – cfr Jan 10 '15 at 21:43
  • @JackTwain -- I just checked the code I posted. It compiles fine. As to the the question, I am going to go with cfr and PaulGessler, you can modify the code, which is well-documented, by marking out the output node and the connection between the hidden nodes and output node. – Jesse Jan 11 '15 at 00:39
  • @Jesse the code really doesn't compile for me I can't figure out why. Since this code http://tex.stackexchange.com/questions/132444/diagram-of-an-artificial-neural-network compiles, can you show me just how to rotate it? I tried the technique you used, but the figure got screwed! – Jack Twain Jan 11 '15 at 07:38
  • The link uses different method involving matrix of nodes which can not be rotated. Please check http://tex.stackexchange.com/a/7649/34618. However, to rotate it, you need to put the matrix of nodes into a node structure. Note: using my approach is easier. – Jesse Jan 11 '15 at 09:11
  • With the lines not orienting from the same point on the circles, the code is somewhat simpler (at least for my PSTricks solution) but it's not what the OP wants, I think. – Svend Tveskæg Jan 11 '15 at 12:09
  • 1
    @SvendTveskæg -- Good observations, thanks. Code corrected and output improved. – Jesse Jan 11 '15 at 12:25
1

A PSTricks solution:

\documentclass{article}

\usepackage{bm}           % for the bold \cdots
\usepackage{pstricks-add} % for the rest of the drawing

\def\pointTop(#1)#2#3{%
  \pscircle[
    linewidth = 1.7\pslinewidth
  ](#1){0.35}
  \rput(#1){\textcolor{red}{#2}}
  \uput[90](#1){#3}}
\def\pointBottom(#1)#2#3{%
  \pscircle[
    linewidth = 1.7\pslinewidth,
    fillstyle = solid,
    fillcolor = gray!50
  ](#1){0.35}
  \rput(#1){\textcolor{red}{#2}}
  \uput[270](#1){#3}}

\begin{document}

\begin{pspicture}(-0.35,-0.69)(5.95,2.77) % found manually
\psset{labelsep = 14pt}
  \pnodes{P}(0,2)(1,2)(2,2)(5.5,2)(3.75,2)(0.5,0)(1.5,0)(2.5,0)(5,0)(3.75,0)
  % nodes and labels
  \multido{\iA = 0+1, \iB = 5+1, \iC = 1+1}{3}{%
    \pointTop(P\iA){$c_{\iC}$}{$h_{\iC}$}
    \pointBottom(P\iB){$b_{\iC}$}{$v_{\iC}$}}
  \rput(P4){$\bm\cdots$}
  \pointTop(P3){$c_{n}$}{$h_{n}$}
  \rput(P9){$\bm\cdots$}
  \pointBottom(P8){$b_{m}$}{$v_{m}$}
  % connections
  \multido{\i = 0+1}{3}{%
    \multido{\r = 0.5+1}{3}{%
      \psline(\i,1.65)(5,0.35)
      \psline(\i,1.65)(\r,0.35)
      \psline(5.5,1.65)(\r,0.35)}}
  \psline(5.5,1.65)(5,0.35)
  \pcline[
    linestyle = none,
    offset = 12pt
  ](P3)(P8)
  \ncput{\textcolor{red}{$w_{nm}$}}
\end{pspicture}

\end{document}

output

Shorter code but (probably) less readable:

\documentclass{article}

\usepackage{bm}
\usepackage{pstricks-add}

\def\pointTop(#1)#2#3{%
  \pscircle[
    linewidth = 1.7\pslinewidth
  ](#1){0.35}
  \rput(#1){\textcolor{red}{$c_{#2}$}}
  \uput[90](#1){$h_{#3}$}}
\def\pointBottom(#1)#2#3{%
  \pscircle[
    linewidth = 1.7\pslinewidth,
    fillstyle = solid,
    fillcolor = gray!50
  ](#1){0.35}
  \rput(#1){\textcolor{red}{$b_{#2}$}}
  \uput[270](#1){$v_{#3}$}}

\begin{document}

\begin{pspicture}(-0.35,-0.69)(5.95,2.77)
\psset{labelsep = 14pt}
  \pnodes{P}(0,2)(1,2)(2,2)(5.5,2)(3.75,2)(0.5,0)(1.5,0)(2.5,0)(5,0)(3.75,0)
  \multido{\iA = 0+1, \iB = 5+1, \iC = 1+1}{3}{%
    \multido{\r = 0.5+1}{3}{%
      \psline(\iA,1.65)(5,0.35)
      \psline(\iA,1.65)(\r,0.35)
      \psline(5.5,1.65)(\r,0.35)}
    \pointTop(P\iA){\iC}{\iC}
    \pointBottom(P\iB){\iC}{\iC}}
  \rput(P4){$\bm\cdots$}
  \pointTop(P3){n}{n}
  \rput(P9){$\bm\cdots$}
  \pointBottom(P8){m}{m}
  \psline(5.5,1.65)(5,0.35)
  \pcline[linestyle = none, offset = 12pt](P3)(P8)
  \ncput{\textcolor{red}{$w_{nm}$}}
\end{pspicture}

\end{document}