Is it possible to show marks when there is a certain distance along the path has been reached?
Example
With
\documentclass[10pt,tikz]{standalone}
\usepackage{pgf}
\usepackage{tikz}
\usepackage{pgfplots}
\pgfplotsset{compat=newest}
\begin{document}
\begin{tikzpicture}
\begin{axis}[]
\addplot[
blue,
domain=0:10,
samples=201,
mark=*,
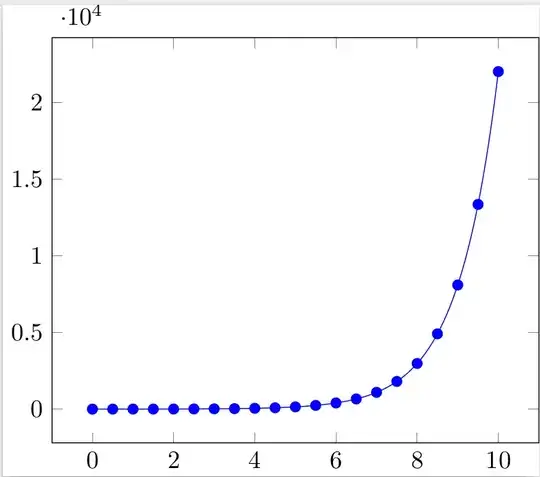
mark repeat=10]
{exp(x)};
\end{axis}
\end{tikzpicture}
\end{document}
You will obtain
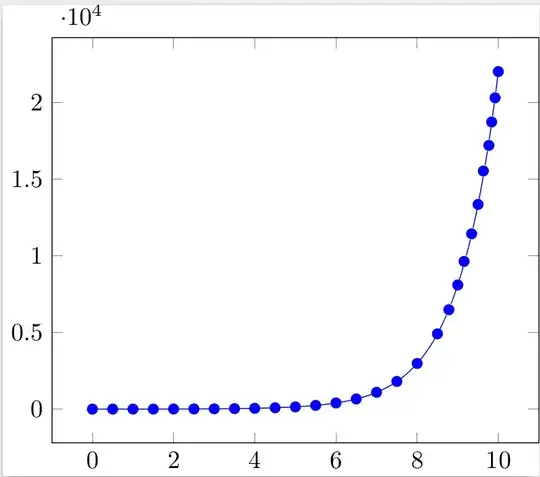
While my prefered output would be


pgfplotsloadstikz, which loadspgf, so loading the latter two explicitly is not necessary. Note thattikzis actually loaded twice, once in thedocumentclassoptions, once by\usepackage:-) Related: I presume you mean "distance along the path", since the points are already equally spaced horizontally. If that's the case, you should clarify in your question. – darthbith Feb 05 '15 at 19:29